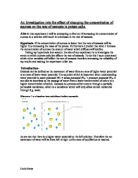
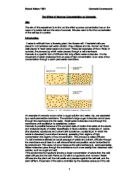
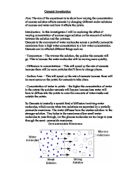
Sometimes in plant cells there is a process called plasmolysis which occurs. This is where the protoplast begins to decrease in size and water moves out of the cell, due to a higher water potential outside the cell. This happens in hypertonic solutions and is represented in the diagram below.
Microsoft Paint
Variables
Independent Variable - The mass of the potato.
Dependent Variable - The Sucrose solution.
Control Variables-The first variables which will dramatically affect the rate of osmosis are the mass and surface area of the chip. Therefore it is necessary to use the same equipment to measure the potato and it is vital to keep the mass and surface area the same.
The second variable which I must keep the same is the temperature of the substances, otherwise if there is a higher temperature the rate of osmosis will be faster so the results will be unreliable. Therefore it is necessary to do all experiments at room temperature.
Method for preliminary experiment-
Calculating 1M sucrose solution-
To calculate the molarity of the sucrose solution, I must first take each element into account.
Carbon-relative atomic mass of 12
Hydrogen- Relative atomic mass of 1
Oxygen- Relative atomic mass of 16.
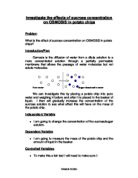
The formula for sucrose is C12H22O11
Therefore I must do (12x12) +(1x22)+(16x11)=342g. When mixed with 1 dm3 of water it will give 1M sucrose solution.
Equipment-
- 4 Beakers- To store each solution of sucrose
- Scalpel- To slice the potato into 2 gram cylinders
- Ruler- To measure the length of the potato chip
- Electrical Digital balance- To weigh the potato chip
- Distilled water- Used to combine with the sucrose to give a different range of concentrated sucrose solutions.
- Measuring cylinder- to calculate the amount of sucrose and distilled water used.
- 1M Sucrose solution- Used to combine with the water to give a range of different concentrated solutions.
- Potato-Variety-“ marfona”-Used to uptake water through osmosis.
0.2 M sucrose solution by using 20 millilitres of sucrose solution and 80 millilitres of distilled water. I then poured the contents into a beaker. I then prepared 0.4 M sucrose solution by taking 40 millilitres of 1 M sucrose solution and 60 millimetres of distilled water and emptied it into another beaker. Finally I measured 60 millimetres of 1 M sucrose solution and 40 millimetres of distilled water to make up 0.6 M sucrose solution.
I now had 3 beakers each with 100 ml of different concentrations of sucrose solution. As a second control I used 100 ml distilled water (with a water potential of 0).
I then did the experiment for 30 minutes on the 4 chips. The results are shown in the table below.
Risk Assessment- In this experiment it is necessary to wear protective eye wear as there is glass wear present. However the experiment is reasonably safe and there are little precautions I have to take to create secure and working environment.
Evaluation of preliminary results- From viewing the results and graph of my preliminary study I can see only a slight negative correlation and can see several problems with my method. Firstly the duration for which the potato chips were left in the solution was too short and the mass didn’t show a considerable change. This shows that little osmosis took place therefore this is one aspect of my method which must be changed.
A second variable which I must change is the quantity of chips which I will use when performing the experiment. Because I only used one chip for each solution it limited the validity of my results. Also when I was measuring the sucrose solution and distilled water I only used a measuring cylinder. Although this gives me fairly accurate results it doesn’t compensate for the accuracy I could achieve using a standard flask as well as a measuring cylinder. In my final experiment I will firstly measure the sucrose solution and then empty it into a standard flask and do the same for the distilled water. When both solutions are in the flask they should be level with the 100ml marker on the flask. After the solutions have been measured I will use parafilm to block the opening of the flask and then tip the solution upside down once and then empty the contents into a beaker. If I do this exactly the same with each different concentration of solution will have had the same amount of energy given to it.
When measuring the length of the potato chip I now know that it will be more accurate to use a vernier calliper instead of a ruler. Also in my final experiment I have decided to use a wider range of sucrose solutions to show more evidence that when the concentration of sucrose is increased the rate of osmosis decreases.
Final Method-
Equipment-
- 6 Beakers (with a capacity of 400ml)- to store each different concentration of sucrose solution in.
- Scalpel - To slice the potato chip into a 2grams cylinder.
- Tile- to cut the potato chips to the right size.
- Vernier Caliper- To obtain the most accurate measurements when measuring the length and width of the potato cylinders.
- Electronic Digital Scale-which is used to measure the mass of the potato chips in the best possible way.
- Cork borer (0.9 mm diameter)-used to produce a diameter of 0.9mm for each potato cylinder.
- Measuring cylinder-to attain the correct amount of distilled water for each solution.
- Volumetric Flask-used to mix both the sucrose and distilled water to the correct concentration.
- 1M sucrose solution-used to combine with the distilled water to make the correct concentration of sucrose solution.
- 6 potatoes of the “marfona” brand - used to take in the solution through osmosis
- Distilled water-used to combine with the 1 M sucrose solution to give a range of different concentrations of sucrose solution.
- Stop Watch-to measure the time the potato is exposed to different concentrations of sucrose solution.
- Forceps -used to pick the potato chip out of the solution of the solution
Step 1- Gather equipment and assemble into position. (figure #2)
Step 2- Insert the cork borer into the potato (you should be able to make around 5 incisions into each potato). Once all of the incisions have been made you will be left with 30 different sized chips.
Step 3- Using the vernier callipers and the electronic digital scales to make sure the chips are of the same length and mass.
Step 4- Calculate the ratio of distilled water to sucrose solution for each solution. Ranging from 0 M to 1 M of sucrose solution, do this using a volumetric flask.
Step 5- Empty the different concentrations of sucrose solutions into the 6 different beakers labelling the beakers 0.2 M etc.
Step 6- Firstly put 6 chips into the beaker 0 M and after a 2 minute interval put a further 6 chips in beaker 0.2. Continue this procedure for all concentrations of sucrose solution.
Step 7- After one hour of the first set of chips being in solution 0 reweigh them and record the results. After 2 minutes re weigh the other set of results. Continue reweighing each set every 2 minutes. And you will have recorded how much heavier the chip has got after 2 hours.
Diagram of the experiment- Figure #2
Results: from osmosis experiment
Calculating the Standard Deviation-
Standard deviation is a measure of statistical Dispersion. It is used to show the reliability of the data by how widely spread the values in a set of data are. If all data is equal the standard deviation is 0. Therefore the results which are closest to 0 are the most reliable and support my theoretical prediction. I have decided to work the standard deviation for each solution instead of taking a sample to increase the precision. The main formula which I need to know to calculate the standard deviation is-
0 M solution-
= = 2.29+2.25+2.22+2.23+2.36
5
=2.27g
=2.292+2.252+2.222+2.232+2.362
=25.7775g
=0.051g
0.2 M solution-
= =2.13+2.11+2.10+2.04+2.01
5
=2.078g
=2.132 +2.112+2.102+2.042+2.012
=21.6007g
s=0.045g
0.4 M solution
= =2.052+1.992+1.982+2.032+1.812
5
=1.972g
=2.052+1.992+1.982+2.032+1.812=10.48
=0.08g
0.6 M solution- = 1.84+1.74+1.79+1.84+1.75
= 5
=1.792g
=1.842+1.742+1.792+1.842+1.752 =16.0654
=0.04g
0.8M solution- = = 1.77+1.63+1.67+1.66+1.72
5
=1.69g
= 1.772+1.632+1.672+1.662+1.722
=14.2927g
=0.05g
1 M solution
= = 1.43+1.48+1.45+1.50+1.43
5
=1.458g
= 1.432+1.482+1.452+1.502+1.432
=10.6327g
=0.028g
Analysis- From my graph I can see that there is a strong negative correlation between the concentration of sucrose solution and the average change in mass. This shows that my results are reliable, due to the concentration of sucrose increasing and the average percentage of mass decreasing thus creating a negative correlation. On the graph I have also plotted the standard deviation, which is significant as it shows how consistent all the results are. The lower the standard deviation, the more consistent the results are. As my line of best fit passes through five of the six average percentage changes plotted on my graph it shows that my results present a similar trend running from the lowest to the highest value. Conversely this may support the view that my experiment was performed consistently and I implemented the results in the exact same way for most of the recordings of data. However there is one set of results which are anomalous to the rest of the results. My results for the 0.4 M solution values show a deviation from the line of best fit. This could have been due to a number of different factors and I will raise awareness to this in my evaluation and discuss the experiments validity. I can now predict the results for any sucrose solution between 0 and 1 M concentration.
The first set of recordings showed an increase of 11.9 % after being left in the solution for two hours. This is a noticeable increase in mass from the starting mass of 2 grams. This can be explained by the fact that the water potential was zero at this point (highest water potential). Therefore as there was no solute molecules to slow the uptake of osmosis, the mass will show a larger increase in this solution opposed to any other solution, thus illustrating that the lower the solute molecules present in the solution the faster the rate of osmosis. At 0.2 M concentration the potato chips again showed a considerable increase in mass. However if we compare the chips in the 0.2 M solution to the 0 M solution there is a significant difference in mass-5.2g. This reinforces the fact that the slightest presence of solute (sugar) molecules will cause a much slower uptake of water. The biggest change in mass between two of the concentrated chips is between 0.4 and 0.6 M. There was a change of 10.2g between these two potato cylinders. However I think this has to be explained by the undependability of the 0.4 M results as most of the other results show a change of around 3 to 7 grams. This relates to the errors associated with the 0.4 M readings. Furthermore if I was to look at the highest and the lowest average percentage changed mass it shows that there is a difference of 39g which is clear piece of evidence to support my hypothesis. My results overall conclusively confirm that my hypothesis is correct: If the concentration of sucrose is lower then the rate of osmosis will be higher thus increasing the mass of the potato.
Evaluation-
Overall I think that my method was well thought out and on the day of the experiment I felt that I used the correct health and safety precautions to produce the most effective results. Also I felt that because I used 5 different potato chips for each concentration, it increased the reliability of my results and because each potato chip showed a similar increase in mass for each concentration it reinforced the evidence that my experiment was a fair test. Nevertheless there were still unexplained faults which occurred during my experiment. For example like I previously mentioned my concentrations for the 0.4 M solution are anomalous to the rest of my results. This could have been due to a number of different factors for instance it could have been my original measurements for the 0.4M solution. If I somehow managed to put too much distilled water in the solution it would result in a bigger increase in mass.
I feel I must criticise the overall method of this experiment: this is because I believe there are certain fundamental faults which will cause a sudden unexplained change in the results. They are also hard for experimenters to get around. For example before each weighing of the potato cylinders there is a process where the potatoes must first be dried using a tissue type material. However I found that it was impossible to expose each potato cylinder to the same amount of drying time before being weighed. A longer exposure to the air/tissue would also result in a decrease in mass due to evaporation and absorption. . This raises the question: are the results from my experiment completely scientifically valid?
This leads me on to my next topic of discussion. I have found two significant problems which will result in a change in my result. They are-
- Exposure to the air
- Damage to the potato cells
When I was planning my method I didn’t take into account the effects of the air on the solution. If the beaker is not properly sealed there will be water loss due to evaporation. This would mean that the ratio of water to sucrose will decrease causing the rate of osmosis to decrease. Therefore in the 0 M solution there may have been a bigger increase in the mass of the potato. If I was to do the experiment again I would have made sure that the beakers were covered in cling film to prevent the air from interacting with the water. The bacteria in the air can also interrelate with the potato cylinders when they are not in the solution. Therefore the potato cylinders which are exposed to the air for longer periods of time will not gain as much water due to damage to the cells. This may be another explanation to why the higher molar valued chips gained more mass.
Damage to cells may also occur when putting in and taking the potato out of the beaker using the forceps which again will cause a difference in damage to each separate potato cylinder. This will mean that anomalous results may occur causing a higher standard deviation and jeopardising the consistency of my results. However to improve my method I would use plastic forceps so the amount of pressure the cells are under is decrease, therefore there is less damage to the potato giving me more reliable findings.
If I was to perform this experiment again I would increase the surface area exposed to the solution in relation to the potato’s volume ratio. I would do this to increase the rate of osmosis which would therefore show a more significant change in mass. If I was to make the potatoes into a smaller disc shape it would increase the surface area to volume ratio of the chip. Also if I wanted to increase the reliability of the results I would carry out the experiment twice so I would have two different sets of results with 10 potato cylinders for each concentration. I would then take the average of the results thus increasing the consistency of the findings.