METHOD
Rubber gloves, lab coat and safety spectacles were all put on prior to the experiment. A large batch of the Ariel-brand washing powder solution was diluted into a beaker (2.65ml of powder to 0.5 litres of water). The 35mm film was cut, after being forcibly removed from its casing, into 25mm x 5mm strips ensuring the holes down each side are cut off. The strips of film were then left in direct sunlight until they became black. Six test-tubes were filled with 5ml of washing powder solution then the timer clock was set to zero. The test tubes were placed into the heat block for a short length of time until they had stabilised at the heat blocks temperature. Whilst it was stabilising, the colorimeter apparatus was set up. The colorimeter was plugged into an available plug-socket with the appropriate cable and switched on. Three of the optically perfect crucibles were washed with distilled water, making sure that only the ground sides were handled and the clear sides were not touched (as they needed to remain optically perfect). The appropriate filter was selected, that had the complimentary colour to the colour opacity that was being looked for, blue (470) as a yellow-green colouration is being looked for. Finally the colorimeter was re-set to zero by placing a clean crucible into the inspection port and pressing the R (reference) button. The distilled water crucible was then removed and the colorimeter apparatus was set up. After checking the temperature of the test-tubes in the heat block were at the correct temperature with the mercury thermometer, the first strip was placed into the first test tube and the timer clock was started and timed for 3:00 minutes. A crucible was filled with the coloured solution from the test tube once the 3:00 minutes were up and placed into the colorimeters inspection port. The test button was depressed and the result was recorded. This process was repeated five times with same temperature. The colorimeter was re set using the distilled water crucible after each three attempts (to negate instrumental drift). Once the full 6 repeats had been carried out, the entire experiment was repeated with a different temperature until sets of 6 absorbency readings for 12 different temperatures had been recorded.
Prevention of variation was one of the most important factors in the success of this experiment. Using ‘batches’ of the solution with a fixed ratio and accurate measuring equipment, for example electronic balances would keep the solutions concentration constant.
The use of other accurate measurement equipment at the later stage of transferral of solution, such as measuring syringes ensures a reliable, accurate and repeatable level of solution to be transferred.
Finally the use of electronic equipment, such as the electronic heat-block, would ensure a constant, due to its self-regulatory programming, and accurate result as it is electronically controlled and thus eliminating anomalous equipment-based errors.
To assess the variation of the results at a later point, conducting multiple repeats were necessary. This showed the degree to which the variables had been controlled.
After the mean absorbency at each temperature was calculated it became clear that the results for 30OC may be anomalous and so the experiment was repeated at this temperature.
Results
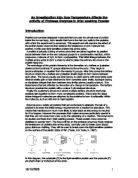
Table 1 – The change in the absorbency of a solution of washing powder and photographic film
Table 2 – Table to show the effect of temperature on the absorbency of a solution of washing powder and photographic film
Discussion
Prior to undertaking my experiment, whilst researching methods, I carried out a simple control experiment. To make sure the light-sensitive protein on the film strip was not water-soluble and thus wouldn’t increase it’s own rate of absorption no matter if there was protease enzymes present or not. When placed into distilled water for more than 15 minutes and checked using the colorimeter, there was no change from regular distilled water’s absorbency values. This positively indicates that the green coloration that happens when there is an addition of protease enzymes is caused by their activity rather than the action of water as a solvent.
The results gathered show there is a definite trend in the results. There are a pair of high absorbency results, one at 55OC (0.847 absorbency units) and one at 30OC (0.78 absorbency units). The result at 30OC seems to be anomalous for reasons I will discuss later, thus presuming the result for 55OC is in the region of the optimum temperature. Leading up to the ‘optimum’ at 55OC there is an upwards slope to the result that starts from 35OC (0.583). This slope indicates that as the temperature increases, the rate of reaction of the protease enzymes increases. I can tell this as the amount of the coloured light-sensitive protein from plastic film-strip that has been removed by the protease increases and thus the absorbency of the solution sample increases. Increasing the temperature in this range will increase the amount of kinetic energy in the solution. All the molecules will move faster and with greater force so that the collisions between active site and substrate not only happen more often but are more likely to result in a successful collision so the rate of the reaction increases.
However, after this peak at 55OC the opposite happens, the rate of reaction begins to fall. This would be due to the protease enzyme denaturing and becoming unable to breakdown the light-sensitive protein. Excess heat can disrupt the bonds holding the tertiary structure of an enzyme together. Enzymes are globular proteins with a structure that is essential to their function. Even a slight change in the tertiary structure can alter the shape of the active site so that the substrate does not fit exactly into the active site because the structure of the active site is no longer exactly complimentary to the shape of the substrate. As the temperature increases, more and more active sites are changed so the overall rate of the reaction decreases.
Within my results there were numerous errors shown by my error bars. There was overlap on 6 of the 11 possible overlap sites on my error bars. This is an obvious sign that my results are not very reliable. However the individual overlaps are notably small ranging from 0.01-0.02 absorbency units. However the largest overlap was of 0.03 absorbency units at 65OC. Due to the overall amount of over-lap an entire re-test of the experiment with revised procedures may be required, or at least a re-test of the results for 65OC. Aside from the small areas of over-lap on the individual error bars, the overall picture still shows an obvious trend of a rise in activity to 55OC. For the results to be shown as perfect a smooth curve or an exactly diagonal line would have to be shown. But from my mean results forming the line on the graph, I can see that the line is diagonal enough for the overall picture my results portray to be used to form a conclusion.
The scientific explanation for the way my results showed a steep increase in absorbency units up to the ‘optimum’ at 55OC is due to particle theory. When the temperature increases, the particles of protease enzyme within the Ariel washing powder solution begin to move faster. The faster they move the greater the chance there will be that they will collide with the strip of film, and thus the light-sensitive proteins. When they collide with the proteins the protein fits into the enzymes active site on the cell membrane and it catalyses the breakdown of the molecule into its separate amino-acids. However, after this ‘optimum’ temperature at which the enzymes are moving as fast as they can, they begin to be affected in a detrimental way by the temperature, they begin to denature. Within the tertiary structure, the heat destabilises the delicate bonding that holds the protein-based enzyme together. The bonds split up and the shape of the protein begins to change, this change in shape can make the active site denature into a better shape. However with the protease enzymes in Ariel washing powder they are not harvested to work better at a higher temperature than 55OC. Their active site denatures in a way that causes the active site to become less able to bind to the protein and catalyse it, the activation energy would thus increase. The activation energy increasing would lead to more of the collisions between substrate and enzyme to being un-successful in reacting and therefore the rate of reaction would be less.
The result at 30OC must also be addressed scientifically. When the enzymes were harvested and selected for the washing powder, they were chosen to have an optimum temperature of activity at the temperatures at which clothes are washed (so that the removal of blood/ gravy etc would be as rapid is possible). The range on most washing machines in 30OC - 90OC but most washes are done at 40OC or 60OC
I was puzzled by the seemingly anomalous results I gained from 30OC, this is due to the fact that the result showed an absorbency value that was almost as high as the visible ‘peak’ of the results at 55OC which I believe to be the optimum temperature. Logically a biological enzyme cannot have two optimum temperatures. I believe the 30OC peak to not be valid as it is below the standard operating temperature range for a domestic washing machine of 40OC to 60OC, this ties in with my presumption that the optimum is around 55OC. However, as at higher temperatures there is a risk of denaturation with enzymes, the enzyme would be harvested for slightly above the compromise of this 40OC to 60OC temperature bracket. This would be so that the post-optimum decrease, due to temperature-based denaturation, would not affect the washing ability of the protease enzymes as much.
There is definitely an optimum temperature between 52.5OC and 57.5OC, and only a revision in experimental technique, number of repeats and a re-test of my experiment using 50OC to 60OC in 1OC graduations would give an exact optimum temperature.
To reach a conclusion using the results, it is essential that they are reliable. Reliability is measured by the similarity between the repeats of a single temperature. If they are very similar it indicates that the variables have been controlled and conclusions may be drawn from them. However if they are very different then they are not reliable and should not have conclusions drawn from them. To show this reliability the range is examined. It is calculated by taking the highest result from the lowest as is calculated in the last column of table 2. It is immediately obvious to see that 30OC and 65OC have the largest ranges (0.11 and 0.09) when compared to the ranges for the other temperatures (0.06 or below). A large range indicates a high degree of variability in the results where as a low range indicates the variables were controlled and thus negligible. There are two reasons for a high range, a series of different temperatures or a single very high or low anomalous result. In the case of the single anomalous result, it can be removed once isolated and this will cause it’s affect on the mean result and range to be negated. However in the case of the series of different results then, depending on how large the range is, the entire set of results for the temperature may have to be re-taken. For 30OC there are three close-together results that are separated by 0.02 absorbency units. But there are two more results which are above this quartet of similar results by 0.06 and 0.07 absorbency units from the highest of the four. As these two ‘anomalous’ results are close together, they may well be the correct results with the other four being anomalous, so removing them from the results would be unscientific. To prove which results are correct, a re-test of this temperature would be required. However, as has been stated earlier the results for 30OC are anomalous for other reasons and a re-test is necessary for those reasons as well. For 65OC the same problem occurs, there is a set of similar results and a set of anomalously high results that are only slightly similar.
However over all of the results gained from this experiment, there is still a range of results, however small they may be. A range of results shows there is variation in my results and thus there are variables that have not been controlled adequately enough and thus there is significant room for improvement in my method and experimental technique.
Evaluation
From my results, and subsequent graph as seen above, it is possible for me to draw a few observations. Primarily it concerns the alarmingly high value for the mean absorbency units for 30OC (0.78). This value is higher than every other value aside from that from 55OC. This value has been collected with the use of the same method and same conditions, therefore it must be a valid mean result and should not be excluded until it’s, apparently, anomalous existence has been proven to be valuable or caused by some extreme variable.
Therefore I must deduce the source of this result, there are a number of areas where this, possible, anomaly may have arisen. Method, substances and measurement, each of these are a source of error. An improper method would be one in which the substances were not pre-heated to the exact temperature before combined, causing a much lower result than would be properly gathered due to the greatly lower temperature than the experiment would require. In substances, if there was great variation in the concentration of washing powder solution used between the different repeats then the results might be skewed up (if the concentration was above set levels) or down (if the concentration was below set levels). Finally measurement is the last possible source of error. If a timer clock is, for example, counts 1.5 seconds for every 1 second then when I took the sample out at 3 minutes only 2 minutes would have passed and therefore my results would be skewed accordingly (ie much lower absorbency ratings across the board).
To deduce the source of the error I must consider each in turn. Method, after carrying out multiple pilots to gain an accurate method I carried each repeat of the experiment sticking religiously to my method and allowed all required time for the mixtures to reach the required temperatures etc. Therefore I am confident that my method is not the source of this anomaly. Second substances, of the three possibilities, I am most sure this one has not been the source of error. As I was only using factory-prepared strips of monochrome film and a batch of washing powder solution, there would be little chance of contamination as the film is individually stable and I kept the washing powder solution covered by cling-film to prevent any foreign bodies entering it. I also only used pure distilled water to wash out my apparatus and therefore that could not have been a source of error. Also, as I was using the same film and same batch of washing powder solution for all my experiments therefore all my results will be skewed by the same amount and therefore I will end up with no individual anomaly due to any error with the substances used. By process of elimination I am led to believe it is my measurement of my results that is the problem. As I was using only one measurement technique, the colorimeter, I am led to believe that somehow that is the problem. Upon investigation of the colorimeters manual I discovered a note that I had over-looked. “Allow 6-10 tests for the colorimeter to achieve optimum accuracy” (Colourwave CO7500 colorimeter manual). This piece of information is invaluable in explaining the first temperatures anomalous results. If the first six tests achieved are effectively written off due to the peculiarities of the instruments then my extraordinarily high results for the first temperature (30OC) are due to the instrument ‘warming up’.
I would have liked to have repeated the results at 30oC and allow the colorimeter to warm properly. I expect that this would show that my first set of results are all anomalies due to incorrect usage of the machine.
Overall, I think that my original hypothesis that the optimum temperature of protease enzymes in Arial washing powder is between 50 and 60oC is likely to be correct but I cannot accept it on the results of this experiment because of the results obtained at 30oC.