Therefore the total energy required in each ‘step up’ the alcoholic sequence is:
744 + 348 + 824= 1916 kJmol-1
2 extra C=O bonds are made = 2 x 805 = 1610 kJ extra energy produced
2 extra O-H bonds are made = 2 x 463 = 926 kJ extra energy produced
Therefore total energy made in each ‘step up’ the alcoholic sequence is:
1610 + 926 = 2536 kJmol-1
So to find the change between each alcohol in enthalpy, we take the first value from the second, which leaves 620kJ. This means that each alcohol further down the sequence will have an enthalpy of 620kJ more than the last. This is how the textbooks obtained their values, however the calculated results used different rounding methods and therefore have a difference of 618 between each.
All this knowledge allows a precise hypothesis to be formulated.
Hypothesis
As one goes down the alcohol series, the alcohols will give off more heat, with pentanol being the most heat producing of the alcohols.
In terms of efficiency, this translates into pentanol being the most efficient of the tested alcohols, as weight and volume are not a factor, for the reasons mentioned in the above initial planning.
In order to investigate and test these enthalpy values and this hypothesis for oneself it was necessary to construct an experiment which would provide a suitable and possible way of obtaining enthalpy values for alcohols in a school laboratory environs.
A preliminary experiment was thus devised to fulfil this purpose. The apparatus was as follows:
Apparatus
Alcohol burner
Clamp and retort stand
Thermometer
Tin vessel
Heatproof mat
Splint
Bunsen Burner
Weighing scales (sensitive to 0.01 of a gram)
Preliminary test method
(See diagram on the next page)
50cm3 of water was placed in the tin cup. Water was chosen as the substance to heat, as we know its specific latent heat capacity, which is 4.2. Knowing this is essential as it is used in the formulae for working out enthalpy from weight loss and heat change.
This water was to be heated a certain amount of degrees, using the alcohol burners. The burners themselves were weighed before and after the heating. This would give us a certain mass loss depending on how efficient that alcohol was at heating the water the set amount of degrees.
20 degrees centigrade was chosen as the amount of change the water would need to go under. The alcohol burners were weighed before on the scale. The water’s initial temperature was noted, making sure that all the initial temperatures of the water were similar (within 2 degrees), and the burner lit using a lit splint from the Bunsen. The thermometer, placed so it wouldn’t touch the tin cup and thus have its readings altered by the cups temperature, was watched to check the temperature change. 20 degrees later the burner was put out and weighed again.
A huge gulf of difference was found between these results and those of the textbooks or calculations. Therefore some improvements needed to be made to the method.
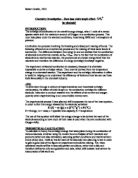
The set of apparatus was set up as below
Diagram
Note the splint and Bunsen were set up elsewhere. Their only purpose was to light the alcohol burner.
The retort stand was set upon a heatproof mat to stop and conduction and damaging of the surface below it. The circle represents the alcohol burner, beneath the tin cup in order to heat it. The thermometer rests within, but not touching, the tin cup.
Improvements
Heat loss was a major factor in the inaccuracy of the preliminary results. Heat was not aimed solely at the tin can with the water. Much of the alcohol burnt therefore was used to heat the surrounding air, not the water in the can. Heat could escape in all directions; therefore this was a huge oversight in the planning of the preliminary test. Heat mats will be used as draught shield and to stop a large amount of heat escaping from our experiment.
The tine cup had a dirty sooty bottom from previous uses. This can stop the full amount of heat given off by the alcohol burner heating the water within the tin can, thus rendering any results inaccurate. This will have to be cleaned in order to obtain accurate results.
This preliminary investigation and experimentation allowed for a full experiment to be formulated with knowledge of how and why, but also how to keep the experiment relatively accurate. Therefore what follows is the final investigation and its crop of results.
Obtaining evidence
Method
As in the preliminary experiment, the apparatus was set up as below
As before 50cm3 of water was placed in the tin cup. The cup was cleaned of soot and dirt before each experiment was undertaken. Once again, the thermometer was not touching the tin cup. The temperature rise was the same, and the starting temperature of the water was still kept within 2 degrees of the first. The alcohols were weighed and lit as before, then weighed again. This time however, the container was weighed with the lid on, to stop alcohol evaporating to and from the scales, rendering the results inaccurate.
The experiment was repeated for extra accuracy. Therefore two sets of results were obtained, which are shown in the tables in the results section.
Results
The above is a table of results from the experiment. Note that the mass change is an average of the two obtained results.
The 4200 represents the specific latent heat capacity of water, but is multiplied by 1000 as it is in joules not kJ.
The enthalpy was obtained using the following mathematical method;
ΔH= -4.2*ΔT*50
ΔH represents the heat energy given off
4.2 is the specific latent heat capacity of water
ΔT is the change in temperature
50 is the volume of the water we used
Then the moles must be calculated
Moles=mass of the alcohol/Mr of the alcohol
Then to calculate the energy per moles, divide ΔH by the moles burnt.
For example:
Ethanol
Energy;
ΔH= -4.2*20*50
ΔH= 4200
Number of moles burnt;
Mols= 1.85(g)/Mr ethanol
Mols= 1.85/46
Mols= 0.0402
Energy per mole= energy/mols
=4200/0.0402=104477J/mol
=104.7kJ/mol
From the results collected it was possible to formulate a graph of the alcohols enthalpies as ascertained by us. Rather than plot the energy/mol against the alcohols names, which would be impossible, the number of carbons, as in the first graph on page 2, will be used to represent each alcohol.
Graphs
The above graph shows a trend similar to the one obtained in the calculated results graph (see page 2). They are both negative linear trends. However there are many differences. The results obtained through experimentation are considerably lower than those of calculations. There is a huge anomaly in ethanol. And the line has a steeper gradient than the calculated graph.
Conclusion
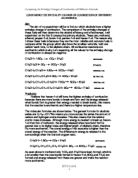
From the comparatory graph it is possible to derive useful conlusions. As was known before, energy is given off, therefore these reactions are definitely exothermic. There is no change between either of the propanols. This is of great importance, as is illustrated below:
Propan-1-ol
Propan-2-ol
As can be seen, both of the propanol variants have the same bonds, just in different places. This means if bond energy theory is correct, they will have the same bond energy and therefore the same energy/mol burnt. And conclusively from our results and calculations this is reflected. They do indeed both share almost exactly, if not exactly, the same enthalpies.
Not only this, but from our reaffirmation of our calculations by the experimental results, it is possible to calculate the enthalpy of butanol, an alcohol not used due to an inability to procure it in our environs. To do so, add 620 to propanol’s value from the text book, or take it from pentanol’s, and the enthalpy of butanol is found to be 2518, which is more accurate than the enthalpy calculated for it earlier.
Differences between results obtained and those expected from calculations
As can be seen on the comparatory graph (Comparison of Experimental Results to those Calculated), there is a huge gap in scale. Whilst the results should have been in the thousands, the ones obtained by experimentation utilising the method detailed previously number in the hundreds. This is easily explained. No matter what measures were undertaken, heat loss could not be minimised in the school laboratory environs. Therefore a large portion of the heat energy was convected away in the air, or conducted through the metal of the apparatus. However, it is safe to assume that if all the alcohols undertook the same heat loss they would still be proportionally correct. So one must compare the shape of the graphs, not the scales.
As can be seen in the comparatory graph is a similar shape emerging to the one expected. Ethanol is evidently an anomaly and should be discounted from there results, yet other wise there is remarkable correlation between the propanols. Less so with methanol and pentanol.
But it is safe to say pentanol is the most efficient fuel, burning roughly 5 times as powerful as methanol. This was only to be expected due to the copious evidence and research pointing to this conclusion. Of course, the most energetic so to speak bond is the bond between carbon and oxygen, therefore the alcohol with the most carbons would logically have the greatest enthalpy. This means that the hypothesis was proved correct, and as such the experiment is a success of sorts.
Evaluation
It is clear that whilst the results obtained were in the right ball park so to speak, there was a large amount of inaccuracy. Not only this, but an anomaly in ethanol, even with averages being taken. This leads one to consider improvements to this investigation.
Improvements
In an ideal situation, measures would be taken to reduce heat loss as far as possible. But as it is impossible to carry out this experiment in a vacuum, due to its need of oxygen gas in the surrounding atmosphere, the best thing to do would be to carry out the test in a sealed heatproof environment. This would increase the accuracy of the results greatly.
More reading could have been taken. At a total of two reading per alcohol, anomalies were still present. To negate this and ascertain more accurate results, numerous repeats could have been done. A good balance between time and accuracy would have been 4 or 5 repeats.
Reading of the thermometer was affected by the surface tension of the liquid inside, yet this is of negligible importance.
No matter how much it was cleaned, there would always be dirt on the vessel for the water, affecting the results. To improve this an easier to clean vessel could be used.
A set of scales with a greater sensitivity would increase accuracy also.
Safety
Goggles and lab coats were worn throughout the proceeding of the experiment, and apart from using a fume cupboard, this was as safe as things could be in a school environs.