METHOD:
I will first immobilise some hydrogenised liver extract in sodium alginate. Then I will drop the beads into test tubes containing 10cm3 of hydrogen peroxide and 1cm3 of buffer solution pH 7. I will wait until the bead hits the bottom of the test tube then time how long it takes for the beads to rise to the surface of the solution. The speed at which the bead rises due to the production of oxygen from the reaction reflects the rate at which the reaction has occurred. Assuming the alginate beads produced are very similar in size and contain equal concentrations of catalase this method should be accurate
.
The temperature of solutions will be controlled with a waterbath set at 40oC (similar to the internal temperature of bovine mammals).
I will try using 5g of liver mixed with 95cm3 of water, blended until the liver is liquidised. I will mix 4cm3 of the liver extract with 6cm3 of 4 g 100cm-3 sodium alginate. These proportions worked well in a previous experiment with yeast catalase so I assume will work equally well in this experiment.
I will start with 1.0 moldm-3 hydrogen peroxide and make further incremental dilutions to find the best concentration of substrate to use. I will also try different concentrations of ethanol to soak the beads in prior to adding them to hydrogen peroxide to find the best concentration to use.
I will try both calf and ox liver to see if there is any difference and to confirm which is the best source of catalase for this experiment.
APPARATUS:
- test tubes
- test tube rack
- beakers
- stopwatch
-
syringe (5cm3)
- Vernier calliper
- filter and filter paper
-
hydrogen peroxide solution (1·0 mol dm-3)
-
sodium alginate jelly (4g 100cm-3)
-
liquidised pig’s liver (5g 100cm-3)
-
calcium chloride (0·1 mol dm-3)
- buffer – pH 7·4
-
ethanol 1.0mol dm-3
- water bath – 40°C
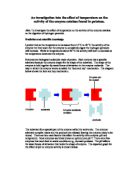
DIAGRAM OF APPARATUS SET UP:
RISK ASSESMENT:
There are various possible risks in this experiment which must be identified and monitored or controlled:
- Hydrogen peroxide is a corrosive chemical which can burn and is an irritant and caustic to mucous membranes, the skin and the eyes. This means that it could cause nausea, vomiting and internal bleeding if it is swallowed as oxygen is produced in the stomach from the reaction of the hydrogen peroxide, this could also cause acute distension of the stomach. Protective eye goggles should be worn at all times during the actual experiment to protect the eyes from this and the chemical will be handled with care in clearly marked containers.
- Catalase, like all enzymes are potential allergens, though I am not using a pure form of this in my experiment so this should not be a problem. Contact with this again should be minimal.
- Ethanol is flammable and toxic. It should not be left exposed to air so will remain in a closed container at all times. In the event of ingestion, excess water should be drunk and medical attention sought.
- Glass instruments are another possible source of harm should any break or crack so care will be taken and correct procedure followed should this occur.
- The copper chloride I will use when making my enzyme beads is another risk as copper compounds are poisonous and can be irritants. To use this chemical safety I will make sure I wear plastic gloves and safety goggles and will store the copper chloride in a closed container that is carefully labelled. If any copper chloride is accidentally swallowed I will seek medical attention immediately.
CONTROL OF VARIABLES:
Independent variables:
- The concentration of hydrogen peroxide will be altered to see what effect this has on the rate of catalase activity in the reaction.
- A supplement experiment with beads that have not been soaked in ethanol will be run as a control to compare results with.
Dependent variables:
Controlled variables: Maintaining Reliability
These must be maintained in order to ensure a fair test and to confirm that the results are reliable (that they could be reproduced similarly in another experiment)
-
The volume of hydrogen peroxide solution must stay at 10cm3 throughout the experiment and will be measured with a syringe. I chose this volume because it fits into a test tube easily. A change in the volume of hydrogen peroxide would cause a change in the concentration of the substrate and therefore alter the rate of reaction due to number of particles in solution available to react. An increase would cause a faster rate of reaction due to more molecules for the catalase enzymes to bind to and break down (as stated in the collision theory) Similarly, less hydrogen peroxide would lower the substrate concentration and cause the rate of reaction to decrease.
- The pH of sodium hydroxide solution can alter the catalase as hydrogen ions could change the shape of the active site (inhibition) so a constant pH must be maintained. Catalase, along with other enzymes, has an optimum pH of 7-8 so a buffer will be used to gain or lose hydrogen (H+) ions to keep the pH of the solution constant, at a similar level to that of bovine blood.
-
A water bath will be used to keep the temperature of solutions at 40oC as higher temperatures will cause more kinetic energy and speed up the reaction due to more collisions per unit time between the enzyme and substrate (‘Collision Theory’). Similarly, a decrease would cause the rate of activity to slow down due to a loss of kinetic energy. Finally, if the rises too much active site will be denatured. 40°C is similar to the body temperature of bovine mammals so it should be the ideal for this experiment. I have also found out that the breakdown of hydrogen peroxide is exothermic. It will release heat and this can be dissipated by the waterbath.
- The size of the enzyme beads must be as consistent as possible; if this varies it will change the concentration of the catalase and therefore alter the rate of reaction. This is due to a higher concentration of catalase would mean more enzymes in solution to bind with substrate. Similarly, smaller enzyme beads would cause a lower concentration and slower reactions. A Vernier calliper will be used to measure the diameter of my enzyme. All enzyme beads will be 4mm in diameter (+ or – 0.05mm)
- The volume of liver and sodium alginate in each bead will affect the mass of the bead. A heavier bead will take longer to rise through the hydrogen peroxide solution. The same batch will be used to make all the beads.
- The length of time that the sodium alginate bead in placed in ethanol prior to the experiment must be the same. Assuming that the ethanol will inhibit the catalase, soaking the bead for longer will cause more inhibition and affect the results. This is why I ran a pilot test find the mot appropriate times to soak the beads for.
- Reliability will be confirmed by conducting the experiment 6 times for each concentration of ethanol. This will allow me to verify the validity of my method. If results are fairly consistent then I can assume that the method was fair and accurate. I will also use the mean results to calculate any trends so that anomalies do not greatly affect my findings.
PILOT RESULTS:
Table1: The effect of substrate concentration on the time taken for a complete reaction using calf catalase and ox catalase
Results shaded are anomalies because they are different from the other repeats.
I have experimented with two varieties of mammalian liver to see if there is any difference. The ox liver/alginate bead results produced a greater range of results than the calf liver/alginate bead. Therefore in the final experiment I shall be using the ox liver.
Pilot 2: To determine the best concentration of ethanol to soak the beads and for how long the beads shall be soaked.
I placed thirty beads of ox liver/alginate beads in a solution of 1moldm-3 ethanol for 10 minutes. However, when I removed the beads and placed them in a beaker of water the beads did not sink. This may be because the ethanol concentration was so high that the water in the beads was drawn out. I then used a concentration of 0.5moldm-3 ethanol and placed the beads in the ethanol for 5 minutes. Again, this lead to the beads floating on the surface of the water. So then I decided to use a concentration of 0.25moldm-3 ethanol and place the beads in the solution for 5 minutes. When I removed them and placed them in the beaker of water they sunk to the bottom. Having concluded that the beads soaked in 0.25moldm-3 ethanol for 5 minutes were most suitable I made six repeats of the experiment at each concentration. I was very careful to wash the beads thoroughly to remove all traces of ethanol before I put the beads into the hydrogen peroxide.
The times taken for these beads to rise from the bottom of the test tube are shown in the table below:
Table 2: The effect of ethanol on the activity of ox liver catalase (raw results)
This worked well so I decided that I could use these pilot results for my main experiment and compare them against what would happen when ethanol was used to soak the beads.
Table 3: The effect of substrate concentration on the rate of ox liver catalase without ethanol to inhibit the reaction (processed results)
Table 4: The effect of substrate concentration on the rate of ox liver catalase with ethanol to inhibit the reaction
Table 5: The mean rate of catalase activity with and without ethanol treatment
DISCUSSION:
Trends in Results:
From the results plotted on the graph it would seem the rate of catalase activity increases as the concentration of hydrogen peroxide increases. There is a strong positive correlation of these results in both the control and the ethanol soaked samples.
Effect of ethanol:
My experiment showed a large decrease in the rate of reaction of catalase enzymes for the batches soaked in ethanol compared to those in the control experiment for example at 0.5mol dm-3 the rate of reaction was 1.0 for the control and only 0.5 for the ethanol beads- half that of the control. At a lower concentration – 0.25 mol dm-3 the rate for the control was 1.9 compared to only 1.2 arbitrary units for the ethanol soaked beads, again this is significantly less.
Ethanol is a toxic to humans and there is a response action that will immediately try to remove it. This takes place mainly in the liver, where enzymes (catalase) convert it to acetaldehyde, which is less harmful.An enzyme aldehyde dehydrogenase then converts the acetaldehyde into acetate ions.
Why I obtained these results
I studied the chemistry behind these reactions to help understand why these results were obtained. The primary structure of catalase is a polypeptide chain (a chain of multiple amino acids).
The secondary structure contains α-helixes (26%) and β-pleated sheets (12%). The rest is made of extended strands and loops.
The tertiary structure is globular and is held together with disulphide bridges and hydrogen bonds. This globular structure that makes catalase soluble in water.
The quaternary structure comprises four monomer sub-units. Each monomer has a porphyrin β heme group and a NADPH molecule. Porphyrin is made up of a photoporphyrin ring and central iron (Fe) atom.
The reaction begins when the catalase enzyme containing iron (Fe (III)) which reacts with a molecule of hydrogen peroxide (H2O2) and forms a compound containing iron. After this oxidation an electron donor returns the compound to its original state so the catalase can react with more hydrogen peroxide:
1. H2O2 + Fe (III)-E → H2O + O=Fe (IV)-E
2. H2O2 + O=Fe (IV)-E → H2O + O2 + Fe (III)-E
Fe-E represents the iron centre of the heme attached to the rest of the enzyme (E).
Increasing the concentration of substrate would cause an increase in the rate of catalase activity because of a larger chance that catalase enzymes will collide with hydrogen peroxide molecules and the active site reacting with the hydrogen peroxide.
The rate of reaction doubles as the concentration of hydrogen peroxide doubles because there are twice the number of substrate molecules so the active sites are twice as likely to collide with a substrate molecule.
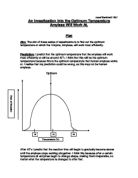
According to this the rate of increase should begin to slow down to a constant rate because the amount of substrate will become saturated (most of the active sites of the catalase enzymes will be in use). Eventually the reaction rate will peak and level off because all available enzymes will be reacting with a hydrogen peroxide molecule.
This could be verified by continuing the experiment with higher concentrations hydrogen peroxide of up to 2 mol dm-3.
EVALUATION:
My results were fairly reliable apart from a few anomalies which I have identified which were probably due to human error. This is fair to assume as I produced six repeats for each concentration and the results were generally very similar. Further repeats and calculations on the mean would provide again more reliability. I did not use my anomalies with when calculating my summary tables and drawing my graph so that they have not been affected.
The is no major differences show in the error bars in my graph so my results must have been quite consistent so I can assume that the results are quite reliable. I can assume that this is due to the degree of control I managed to maintain of the variable in the experiment.
I conducted my experiment in a water bath so the temperature would have remained constant and there would be no change in the amount of kinetic energy which would have affected reaction rate due to the fruitful collision theory (explained in my background analysis)
I used a buffer of pH 7·4 to avoid variation in pH value which could change the shape of the active site of the enzyme and alter or stop its ability to react.
I did my best to keep the size of the alginate bead consistent as a change in diameter would also change the surface area of the enzyme beads varying the enymes exposed to react with the hydrogen peroxide, (This would have had the same effect as altering my concentration.) There will still be a margin of error as a bead with a diameter that is meant to be 4mm in diameter could have an error of up to 1·25% as it could actually measure 4mm ± 0·05mm. This may be partly to blame for the small variance in my results. However, for my anomalous results, there must have been a bigger error than this – either caused by measuring the beads incorrectly, or perhaps the beads shape was distorted or the beads damaged when holding them with tweezers.
The degree of accuracy in measuring solutions only be measured to the nearest 0·5mm, which could effectively have caused a 5% error in the concentrations. In the same way the volumes of pig’s liver and sodium alginate jelly used there could be slightly different as they had to be measured with a syringe.
Time is another hard variable to control accurately. The time spent soaking catalase beads in ethanol was only be measured to the nearest second and this could account for the variance in my results. It is also reflected in the gradual increase in my error bars as the time being measured reduces, slight inaccuracies amount to bigger errors. A slight error in timing for this small time (human error and reaction time could amount to at least 1 second) would result only result in an error of a few percent. However, for the faster reactions (higher concentration) this will have a larger net effect. On the highest concentration the same 1 second variation would cause an 8·5% error in results and is proportionately more detrimental to the accuracy of the results.
CONCLUSION:
I found evidence to suggest that my hypothesis that as the substrate concentration increases the rate of reaction becomes faster was correct. It is also obvious that ethanol will slow down the rate of reaction between pig’s liver catalase and hydrogen peroxide as my results clearly show this. The trend of my results shown in the graphs indicate that as the concentration of hydrogen peroxide doubles, the rate of catalase activity also doubles although as I did not specifically test for this it would not be fair to assume this is totally true.
My results would also suggest that the rate of reaction will slow down to a constant rate but I have not obtained enough results to establish what would happen with greater concentration of hydrogen peroxide. This is something that could be tested in an extension toe this experiment. The variables could also be controlled more accurately to remove any anomalous results although the apparatus required would be highly specialised and not available in many school laboratories.
Bibliography:
Advanced Biology (enzyme properties pg 123, enzyme inhibition pg129)
www.catalase.com