Incubating also causes a quicker reaction. This is due to the addition of energy to the reaction in the form of thermal energy. The thermal energy is converted into kinetic energy, and so all the particles have more energy and so move with a greater speed. This means there are more successful collisions between the enzyme and substrate molecules.
Inhibitor Theory
Inhibitor: A substance that may react with and enzyme, changing its rate of reaction [7].
There are two types of inhibitors irreversible inhibitors and reversible inhibitors of which sodium dihydrogen phosphate is reversible. This means the inhibitor doesn’t permanently change the enzyme. Reversible inhibitors can either be competitive of non-competitive. A non-competitive either blocks or changes the active site of an enzyme [6]. Sodium dihydrogen phosphate is a competitive inhibitor. This means that it is similar in shape to the substrate (phenolphthalein diphosphate), and so competes to occupy the active site of the enzyme acid phosphatase.
As the sodium dihydrogen phosphate is in the place of the substrate the active site is blocked and therefore prevents the binding of the substrate to the enzyme and the formation of the enzyme-substrate complex. This therefore prevents the enzyme assisting the reaction as efficiently, as the substrate has to compete with the inhibitor for the active site of the enzyme. As the inhibitor is competitive it doesn’t stop the reaction, it simply slows it down by making it harder for the enzyme-substrate complex to form. This means that if the substrate were in excess then the maximum rate of reaction could still be reached.
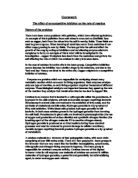
When the concentration of inhibitor reaches a certain level, the difference in rate of reaction decreases. If the amount of enzyme and substrate is kept constant, when there is more inhibitor than enzyme, the inhibitor cannot decrease the rate of reaction anymore. This can be shown as:
This demonstrates that above a certain concentration of inhibitor the relationship between concentration of inhibitor and % transmission will be negligible, as inhibitor will have reached maximum inhibitor. This would also apply for concentration of substrate. This would be for the same reason as the extra substrate would not be assisted by the enzyme.
In my investigation the variable is the concentration of the inhibitor. According to my theory the higher the concentration of the inhibitor, the slower the rate of reaction. This is due to more competition for the active site of the enzyme and so a slower rate of reaction. The rate of reaction will be indicated by the amount of phenolphthalein released. I will add 5cm3 of sodium carbonate, which is an alkali to each of my boiling tubes. As phenolphthalein is an indicator that turns pink in the presence of an alkali my solutions will turn pink on the addition of the alkali sodium carbonate. If the rate of reaction is high, then more phenolphthalein will be released than in a slow reaction. The more phenolphthalein present the darker the pink colour on addition of sodium carbonate and therefore the faster the rate of reaction. This gives expected results of low % transmission for solutions containing a low concentration of inhibitor.
METHODS
Apparatus List
- 50mL measuring cylinder
- 25mL measuring cylinder
- Pestle and Mortar
- 50mL beaker x 2
- Muslin
- 250mL beaker
- Ccentrifuge tubes x 4
- Centrifuge
- Boiling tubes x 11
-
10cm3 pipette x 2
-
5 cm3 pipette
-
1 cm3 pipette x 2
- Boiling tube rack
- Labels
- Incubator
- Teat Pipette x 11
- Cuvette x 12
- Colorimeter
Pilot Study
I carried out three pilot studies. For my first pilot study I used a basic method from [1]. For both pilot studies I extracted the enzyme in the following way.
- In a pestle and mortar place 20g of mung beans, 20ml of water and a pinch of sand. Grind the contents of the pestle and mortar into a pulp.
-
Place a muslin cloth over a 50cm3 beaker and squeeze the pulp through the muslin cloth.
- Divide the liquid evenly between to centrifuge tubes and place in the centrifuge for 5 minutes at 60 r.p.m.
- Pour supernatant into a clean beaker. Dispose of pellet.
- An enzyme solution of acid phosphatase is now ready to use.
My first pilot study involved only two results. One boiling tube contained 10 cm3 of buffer (pH 7), 1 cm3 of the substrate, I cm3 of the enzyme and 5 cm3 of the alkali. This boiling tube acted as a control as no inhibitor was present. The second boiling tube (A) contained the same volumes of alkali, enzyme and substrate, but half the buffer was replaced with 5 cm3 of inhibitor. This pilot study was carried out to demonstrate the effect of an inhibitor on the reaction. The following results were obtained:
Results for Pilot 1
When an inhibitor was present more light passed through the solution showing that less phenolphthalein was released and therefore the reaction was slower. This was expected as an enzyme inhibitor slows down slows down an enzyme catalysed reaction. This pilot study lead to the following being used in the actual experiment.
The volumes of the constants in my experiment will be
-
1 cm3 enzyme, acid phosphatase
-
1 cm3 substrate, phenolphthalein diphosphate
-
5 cm3 alkali, sodium carbonate
Different concentrations of inhibitor will be achieved by using different volumes of buffer and sodium dihydrogen phosphate to make up 10 cm3.
Also the solutions will be incubated for 20 and no longer minutes as research showed that phosphate is a competitive inhibitor.
In the colorimeter a blue filter will be used in the actual experiment as blue is complimentary to the pink coloured solutions produced in this experiment.
I felt a second pilot study was needed as different concentrations of inhibitor needed to be tested. Also I researched and found the optimum pH for acid phosphatase is pH 5. As I had not yet carried out the experiment with this pH buffer I felt another pilot study would be useful.
My second pilot study included 4 boiling tubes made up as follows.
Contents of Boiling Tubes in Pilot 2
As well as these volumes each boiling tube contained 1 cm3 of acid phosphatase, 1 cm3 of phenolphthalein diphosphate and 5 cm3 of sodium carbonate. Again the solutions were incubated for 20 minutes and a blue filter was used in the colorimeter. The following results were obtained:
Results for Pilot 2
These results displayed the trend that as the concentration of the inhibitor is increased the % transmission increases. Therefore showing that the rate of reaction decreases with an increase of inhibitor concentration. Also my results showed that pH 5 buffer was a suitable pH.
I carried out a third pilot study as I felt that there seemed to be small variation between my results. The small amount of variation suggested that there is a limit on the amount of inhibition. This lead me to carry out a pilot study with 11 different concentrations of inhibitor, ranging from 0.00M to 0.10M. I made up the concentrations as follows:
Conentrations for Pilot 3
I added the above concentrations of inhibitor to the constants always added to each boiling tube and incubated the boiling tubes at 25ºC for 20 minutes. I obtained the following results:
Results for Pilot 3
As expected there was not enough variation in my results to carry out a worth while investigation. I then decided to vary the concentration between 0.00M and 0.01M rather than 0.1M. From this pilot study I decided on the range of inhibitor concentration I would be using.
Method
- Place a 250mL glass beaker on a balance and tare, weigh 30g of mung beans into the beaker.
- Place mung beans and 30mL of water in a pestle and mortar. Add a small amount of sand and grind into a pulp.
- Place muslin cloth over mouth of 50mL beaker. Use an elastic band to hold cloth in place if necessary.
- Squeeze pulp through a muslin cloth into a 50mL beaker. Divide the liquid evenly into a 4 centrifuge tubes use a 25mL measuring cylinder to achieve equal volumes. Centrifuge at 60 r.p.m for 5 minutes.
- Pour supernatant into a clean 50mL beaker and dispose of pellet.
- Place 11 boiling tubes in a boiling tube rack.
-
Use a 1 cm3 pipette to measure 1 cm3 of 1% phenolphthalein diphosphate solution, add 1 cm3 to each boiling tube. When measuring volumes of liquids measure from bottom of meniscus and check this at eye level.
-
Use two 10 cm3 pipettes to make up different concentrations of buffer pH5 and 0.01M sodium dihydrogen phosphate. Make following concentrations:
Concentrations for Experiment
-
Label boiling tubes and add 10 cm3 of appropriate inhibitor concentration to each.
-
Using a 1 cm3 pipette add 1 cm3 of enzyme solution to each boiling tube.
- Incubate boiling tubes for 20 minutes in an incubator at 25ºC.
-
Using a 5 cm3 pipette add 5 cm3 of 10% sodium carbonate to each of the boiling tubes.
- Wipe a cuvette with a paper towel and use a teat pipette to fill a cuvette with water. Place cuvette in colorimeter, set the filter to blue, and set colorimeter to zero, display should show 100% transmission.
- Wipe all 11 cuvettes before use. Fill each cuvette with a different solution use a different teat pipette each time.
- Place cuvette in colorimeter and take reading. Between each solution place cuvette containing water in colorimeter and reset to zero. Continue until all readings have been obtained.
Choice of Techniques
I chose to carry out my experiment using certain techniques. The reasons behind this choice of techniques follow.
30g of mung beans were used as this gave a volume of approximately 40cm3 of enzyme solution. This provided enough solution to carry out the experiment.
A centrifuge was used as solids such as sand may still have passed through the muslin cloth. A centrifuge ensured no impurities were present in the enzyme solution.
11 different concentrations of inhibitor were used for a sufficient variation of results being obtained, considering time constraints.
The smallest sizes of pipettes were used to ensure maximum accuracy. For instance 1cm3 pipettes were used to measure out volumes of 1cm3.
Concentrations of inhibitor were made up to 10cm3 as calculations were facilitated by this as well as considerable end volumes being achieved in the boiling tubes. The end volumes in the boiling tubes displayed results well.
PH 5 buffer was used as through research I found that this was the optimum pH for the enzyme acid phosphatase.
Solutions were incubated for 20 minutes at 25°C. This time of 20 minutes was used as the inhibitor sodium dihydrogen phosphate is competitive and so if solutions were incubated for longer the quality of results would have been sacrificed. These solutions were incubated to overcome activation energy (mentioned in theory).
In the colorimeter a blue filter will be used in the actual experiment as blue is complimentary to the pink coloured solutions produced in this experiment.
Once concentrations were made up different apparatus were used for each concentration. This prevented contamination.
Controls
Through out my experiment it was essential that all variables apart from concentration of inhibitor were kept constant. This was to ensure a fair test. The following table displays the way in which variable could have effected my results:
N.B It must be assumed in all cases that the negative effect of what is stated in the effect column is also true. E.g. An increase in enzyme concentration would cause an increase in rate of reaction. It is also true that a decrease in enzyme concentration would cause a decrease in rate of reaction.
Risk Analysis
ANALYSIS
Data Tables
I will display my results on the following table:
Results Table
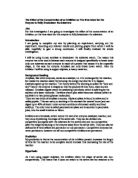
My expected graph:
This graph displays a positive correlation between the Concentration of inhibitor and % Transmission.
Results
I obtained the following results:
Experiment Results
The 1st % transmission results for the inhibitor concentrations of 0.001, 0.002 and 0.003 are highlighted as they do not follow the trend as well as the rest of the results. They are not anomalies as they do still follow the trend but the evidence for the trend is weakened by these results.
In my pilot study I carried out my experiment with concentrations of inhibitor ranging from 0.0M to 0.1M. Whereas in my actual experiment I used concentrations of inhibitor ranging from 0.0M to 0.01M. I achieved successful results in my pilot study and so they can be added to my actual experimental results to achieve a wider range of results.
Results Including Average Experimental Data and Pilot 3
The 0.009M value is highlighted as it is an anomaly. This is likely to have been caused by the combination of two sets of results carried out at different times. This value shows where the two sets of results mix. This result may be correct but it does not follow the second set of results and so appears as an anomaly.
DISCUSSION AND EVALUATION
Explanation of Patterns
My alternative hypothesis stated that ‘As the concentration of sodium dihydrogen phosphate is increased the rate of reaction will decrease. This will be indicated by a decrease in % transmission as concentration of inhibitor decreases. ‘
From my experiment I have provided evidence for this. There was a general positive correlation between concentration of inhibitor and % transmission in graph 1. As the average % transmission increased from 39 to 83.5 as the inhibitor concentration (M) increased from 0 to 0.01. My theory explains the reasoning behind this. As the concentration of inhibitor increased, the rate of reaction decreased, less phenolphthalein was released, the solutions became lighter and so there was a higher % transmission. In my theory it is explained how the inhibitor causes the rate of reaction to decrease by occupying the active site of the enzyme. This data adds strength to my theory as there is a positive correlation between concentration of inhibitor and % transmission, and therefore I accept my alternative hypothesis as well as rejecting my null hypothesis.
In graph 2 more evidence has been added to my theory as it displays the pattern in % transmission and concentration above 0.01M. There is still a positive correlation but it is not as strong as below 0.01M. This is displayed on the graph as it levels out. In my theory I was unsure at which concentration of inhibitor the % transmission would begin to level out. After completing my experiment I found that the graph began to level off between 0.01M and 0.02M. This suggests that when the level of substrate and enzyme is constant at a certain inhibitor concentration (0.01:0.02M) the amount of inhibition reaches its limit.
Error Analysis
Possible errors may have occurred when:
-
Measuring 1cm3 of phenolphthalein diphosphate: error +/- 0.01
- Measuring volumes of buffer: error +/- 0.1
- Measuring volume of sodium dihydrogen phosphate: error +/- 0.1
-
Measuring 1cm3 of enzyme solution: error +/- 0.01
-
Measuring 5cm3 of sodium carbonate. +/- 0.1
- Colorimeter +/- 1
On my graph I have assumed that all errors for inhibitor concentration will be +/- 0.1, but the possible error will increase as smaller volumes of inhibitor and buffer are measured.
Limitations of Techniques
Although I completed my experiment to a successful level I was limited by the amount of time available to complete my experiment. The longest time period I had to complete my experiment was 90 minutes. This meant my experiment had to be carried out quite rapidly due to also having to extract the enzyme in that time. As my experiment was slightly rushed this may have caused errors in areas such as measurements. This would have lead to anomalies in my results. I was not limited in any other way during my experiment. I had enough space to carry out the experiment well. As I was only slightly limited by time all that may have been sacrificed is attention to detail. If i had had access to professional apparatus such as a spectrophotometer, then the accuracy in my experiment may have improved.
Suggestions for Further Study
Obviously to gain a further understanding for this topic I would carry out tests at more concentrations of inhibitor. I would especially aim to gain more results for the concentrations of inhibitor between 0.01M and 0.02M. I would do this as this is where the graph levelled off. By obtaining these values I would find where the maximum inhibition. To obtain these concentrations I would make up the following:
To these concentrations I would add the constants to each boiling tube as in the experiment I carried out in this investigation. These were 1cm3 of substrate, 1cm3 of enzyme and 5cm3 of alkali. I would then obtain these results in the same was as in this investigation.
Also to further my knowledge on this topic I would carry out the experiment in the same way but change the variable of pH. This would show me what the optimum pH for the enzyme acid phosphatase is. I have researched this but to be sure which is the best I would carry out an experiment to show this. To do this I would not use any inhibitor, as this slows down the reaction and in this case this is unnecessary as inhibitor concentration would not be investigated. I would add the same volume of buffer, enzyme and substrate to each boiling tube. The variable would be the pH of the buffer. To vary this I would add the same volume of different pH buffers to each boiling tube.
APPENDICES
References
[1] www-saps.plantsci.com.ac.uk
[2]
[3]
[4]
[5]http://en.wikipedia.org/wiki/Centrifuges#Different_types_and_uses
[6]Introduction to advanced biology
Cj clegg
John Murray publishers 2000
[7] Teachers notes