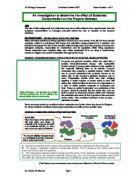
Graph 3 (A Graph showing My Second Prediction)
Prediction 2(a): Again, if all factors were kept constant, I predict that as the time increases, the volume of Oxygen produced in the reaction between Catalase and H2O2 will increase, until after some time the rate at which Oxygen is produced would gradually slow down, and eventually completely stop. The initial reaction when the substrate molecules are added to the enzyme molecules, would be very swift, hence, I am expecting my results to produce a straight line on the graph, within the first few seconds of the initiation of the timing.
-
This is because, as soon as the Catalase and H2O2 come into contact with each other, there will be a large number of substrate molecules around, and all enzyme molecules will be available for the H2O2 molecules to bind with their active site. Therefore, at the very start of the timing, (nearest to 0s as possible), the maximum amount of Oxygen able to be produced at any one time, will be released. This is why bubbles of Oxygen should be collected very quickly at the start. The rate at which the reaction occurs entirely depends on the number of enzymes present, and the rate at which they convert the H2O2 substrate into its products, i.e. water and Oxygen, and release them, and then bind with another substrate molecule. The curve should therefore be steepest at the beginning of the reaction.
-
However, as more and more substrates are converted into products, there will be fewer and fewer substrates to bind with the enzymes, which means the enzyme molecules will be ‘waiting’ for the substrate molecules to hit their active site. As fewer substrate molecules are left, the reaction gets slower and slower, until it eventually stops, when there are no more H2O2 available to be converted into Oxygen. Therefore, even if the timing was carried on, no further Oxygen will be collected, hence the curve levels off, as substrate concentration becomes the limiting factor.
Prediction 2(b) a comparison between the concentrations: I also predict that the higher the substrate concentration, the steeper the curve would be and the higher the curve would reach. Therefore, meaning that more oxygen will be produced at any one time and more oxygen would be released in total, with a high concentration, compared to that of a lower concentration. As well as this, I presume that no oxygen will be produced when the substrate concentration is 0%. Furthermore, I suppose that for a higher concentration, it would take longer time for the volume of oxygen collected to stop increasing and as a result for the graph to level off. This is why the point at which the 100% concentration curve levels off (marked with a cross) is further along the x-axis (time axis) compared to the levelling off point of the 25% concentration curve.
- The curve should be steeper because, when a higher substrate concentration is used, there would be a larger number of substrate molecules present in the reaction solution, which means that the constant number of enzymes will be provided with more substrate molecules. Hence, more of their active sites will be filled and working, as a result producing more oxygen in a given time, compared to a reaction with a lower substrate concentration.
- The curve would be higher when the substrate concentration is higher because, there would be more substrate molecules present, hence more products being formed and released.
- At 0% substrate concentration, there are no substrate molecules present for the enzyme to break down and produce oxygen as a product, therefore no oxygen is collected.
- Finally, at high substrate concentrations since there are more substrate molecules for the constant number of enzymes to break down compared to a low concentration, it would take longer time for the enzymes to have converted all the substrate molecules present in the solution into products. Hence, the point at which no more oxygen is collected (i.e. the reaction has stopped as there are no more substrate molecules left to be broken down releasing oxygen), is further along the time axis, compared to that of a lower substrate concentration.
PRELIMINARY EXPERIMENT/SECONDARY SOURCES
The preliminary experiments should help me gather several sets of results, which will eventually help to decide upon the manner by which final experiments are carried out. I will be considering and looking out for the appropriate method structure to use; equipment and apparatus, including volume and concentrations of solutions I am going to use; and measurements required to be taken in order for high quality sets of results. I will also be looking out for any ways in which the method can be made reliable, in order to produce accurate results.
Secondary Sources
From a previous experiment ‘the effect of pH on the activity of the enzyme Catalase’, which is my so-called secondary source of information, I have gathered material about buffer solutions and which ones work most appropriately with enzymes. Through the results I obtained during this previous experiment, I understand that Catalase along with “most other enzymes” [a fact taken from the OCR BIOLOGY 1, textbook], work efficiently and at the fastest rate, at a pH of about 7, (in fairly neutral conditions). Therefore, I am going to be using ph7 buffer solution in my experiments, to maintain the pH of the reaction solution.
Since I will be using the same solutions and because I will need a way of measuring the volume of Oxygen produced during the reaction, the apparatus, which I have considered to use for this experiment, is the same as that of which I used for the experiment mentioned above.
Apparatus and Equipment List
-
3.0% Hydrogen Peroxide (H2O2) solution
- pH7 Buffer solution
- Minced Potatoes, containing Catalase
- Tap water
-
25cm3 Measuring Cylinder
-
10cm3 Measuring Cylinder
-
10cm3 syringe
- Conical Flask attached with a vertical glass tube and Hypodermic needle
- Stopclock
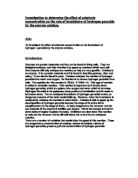
Diagram 3 (An Apparatus Diagram for the Preliminary Experiment)
Preliminary Procedure
- The apparatus in diagram 3 was set up.
-
A ‘certain volume’ of minced potato was placed in the conical flask, and 10.0cm3 of pH7 buffer solution was measured using the 10cm3 measuring cylinder and added to the flask, which was swirled in order to mix the solutions. I varied this ‘certain volume’ of minced potato, starting from 5.0cm3 to 2.0cm3.
-
Then a ‘certain volume’ of the 3.0% H2O2 was measured into a syringe. Again, I used a variety of volumes of H2O2, from 5.0cm3 to 1.0cm3.
-
Then, this syringe containing that ‘certain volume’ of 3.0% H2O2 was placed in the Hypodermic needle in the bung of the conical flask, as shown in the apparatus diagram.
-
The H2O2 was then injected into the flask.
- Then immediately the stopclock was started, and the volume of Oxygen collected in the inverted measuring cylinder was recorded every 30 seconds for 5 minutes.
-
Since substrate concentration is the factor, which is being investigated, the experiment was repeated using 3 different H2O2 concentrations, which were 3.0%, 1.5% and 0.0%. To make the 1.5% concentration of H2O2, I used a mixture of 2.5cm3 3.0% H2O2 and 2.5cm3 water. The 3% concentration is 5.0cm3 H2O2, and a 0.0% concentration is 5.0cm3 water, without any traces of H2O2.
Table 2 (A Table showing the Preliminary Results)
Preliminary Evaluation and Final Decisions
My preliminary experiment gave me a rough idea of the possible outcomes of this investigation. It was evident that there is a link between the substrate concentration and the enzyme activity. I carried out this preliminary experiment to determine the maximum and minimum values of the variable i.e. the concentration of the Hydrogen Peroxide, and the intervals of between the different concentrations, and the exact volumes of the solutions I was to use. As well as, determining how long I was going to measure the volume of Oxygen released and for what interval of time, and how many repeats I was going to carry out.
When using the 5.0cm3 minced potato solution, I found that there were too many Catalase molecules present in the solution, which meant that the Hydrogen Peroxide was decomposing at a very high speed. This meant that I found it difficult to record the volume of Oxygen produced in the 30s intervals. Therefore, I considered the lower volumes of minced potato, the lowest being 2.0cm3, since 1.0cm3 would have contained a small quantity of enzymes. However, in this particular case, the number of Catalase molecules present were so little, that the Hydrogen Peroxide molecules were provided with hardly any active sites to bind with, which meant hardly any Oxygen was being released. Therefore as a result, I decided to use 3.0cm3 of minced potato solution, as it was the most suitable volume, at which the amount of enzymes present, allowed me to easily measure the volume of Oxygen produced, without the reaction working too fast, too slow or not at all.
On the other hand, it is important that the concentration of Catalase is kept constant throughout the experiment, therefore, I am going to measure 3.00g of minced potato, rather than a volume of 3.0cm3. This is because when 3.0cm3 of minced potato was measured using a syringe, during the preliminaries, most of that volume was the fluff and air produced during the mincing of the potatoes, and not the liquid, which meant that the Catalase content was varying from volume to volume. However, if the mass of minced potato was weighed, the enzyme content in all the experiments would be the same.
I had to make sure that the volume of Hydrogen Peroxide was just about enough to provide the Catalase molecules with substrate molecules so that they wont have to be ‘waiting around’ for a substrate molecule to collide and bind with them. Hence preventing the reaction from being slow and inefficient for practical purposes. And since I have decided to use 3.00g of minced potato solution, containing Catalase, and since there had to be more than enough Hydrogen Peroxide molecules around during the reaction, I decided upon using 5.0cm3 of Hydrogen Peroxide solution. These suitable volumes of reactant solutions contain more substrate molecules than enzyme, meaning that the enzymes will be faced with frequent collisions resulting in continuous cycles of reactions. Therefore, the Oxygen being produced would be sufficient enough for me to measure and record, as well as there being plenty of substrate molecules for the reaction to continue for some time, in order for me to observe the reaction over a long and adequate period.
In my assignment, it was decided that the substrate concentration was the independent variable, therefore, I have to vary the concentration of Hydrogen Peroxide, in order to see the effect a varying substrate concentration has on Catalase activity. During the preliminary experiments, I noticed that the highest concentration that could be used during my experiments was 3.0% since the substrate going to be used, i.e. Hydrogen Peroxide, is highly toxic when it’s in high concentration states. A 3.0% concentration is a state at which Hydrogen Peroxide is safe to use within school laboratory conditions. The 0.0% Hydrogen Peroxide concentration was used as a control, in order to determine that Hydrogen Peroxide is the factor, which causes the Oxygen to be evolved, in the reactions. However, even though concentration of Hydrogen Peroxide was 0.0%, and there is no Hydrogen Peroxide present in the solution, Oxygen bubbles were produced, which was probably due to an error in the experiment.
I am going to use the 0% Hydrogen peroxide concentration as my control, trying to prove that when there’s no Hydrogen Peroxide solution, there will be no substrate molecules for Catalase to break down, hence producing no bubbles of oxygen. By using the results from this control substrate concentration, which should show that no bubbles of oxygen are collected, I could see how my successful my experiment was.
Now that I know the maximum and minimum concentrations are 3.0% and 0.0% respectively, I have to consider the number of different concentrations (i.e. variables) I am going to use and the intervals between them. To start of with, I understand that I have to make these different concentrations, from the given 3.0% concentration, therefore, it is important that I choose a reasonable and sensible range of concentrations. Since it is important that the concentrations are as precise as possible, I have decided that I do not want to use concentrations which will result in me having to measure out volumes with decimal values, which wont be as exact and accurate as whole numbered volumes. For example, my 1.5% Hydrogen Peroxide concentration resulted me in using 2.5cm3 of both 3.0% Hydrogen Peroxide and water. However, if I had to make a 1.8% Hydrogen Peroxide concentration, I would only have to use 3.0cm3 of the 3.0% Hydrogen Peroxide and 2.0cm3 of water, which are much easier volumes to measure accurately.
Also, as it would be sensible to use a range of substrate concentrations, I decided to test 6 different variable concentrations, with intervals of 0.6%, which require whole numbers for the volume combinations. In order to make 5.0cm3 of the different Hydrogen Peroxide concentrations, the 3.0% Hydrogen Peroxide has to be diluted using distilled water, but not tap water, which I initially used in my preliminary. This is important, since contamination has to be minimised, as much as possible and tap water is known to contain other chemicals, hence it isn’t a pure source of water. By diluting the 3.0% Hydrogen Peroxide solution, the number of Hydrogen Peroxide molecules (in the 5.0cm3 solution) will be decreased, and the number of water molecules increased, hence lowering the substrate’s concentration. I used the following calculation to work out the volumes of the solutions required to be mixed, in order to make the different concentrations of Hydrogen Peroxide.
Table 3 (A Table showing Volumes of solutions needed to make Different Concentrations)
Now that I have sorted out all the volumes, I am going to consider the improvements that could be made to the procedure and the timing, as well as deciding on the number of repeats I am going to carryout. On the topic of repeats, I found that my results from the preliminary weren’t very similar, there was a lot of variance noticeable within the particular variable concentrations. Therefore, I decided that the more repeats I carry out the more accurate my average values would be. It would be ideal if I was able to carry out 3 trials, however, since I do not have a lot of time in the carrying out sessions, I am going to aim for 2 trials for each variable. The preliminary results showed that there was some error associated with my measurements and recordings, as they weren’t all the same and they varied significantly. This was caused mainly by human error and on a more specific note, my reaction time, which is difficult to overcome. However, by carrying out the repeats this effect should be minimised, improving the reliability of the final results and making them more accurate. An important point to remember is that the trials for the same variable should be carried out on the same day, as close to each other as possible, because it’s important that the conditions in the laboratory are the same for each variable.
The timing using the stopclock is also related to Human error and reaction time, so it’s important that I can see the time on the stopclock as well as the reading on the measuring apparatus. Speaking of timing, I think 5 minutes is too long for each trial, because in some of the preliminary experiments when I used the 3.0% Hydrogen Peroxide, the measuring cylinder I used was too small to collect all the Oxygen released during that long period. Also, if I was to be able to do repeats I would need to cut down the timing, to 240 seconds, i.e. 4 minutes. By doing this, I have plenty of time to observe the changes to the activity of the enzyme during the reaction, as well as getting as many readings as possible. However, I still will be counting the Oxygen produced at intervals of 30 seconds, since I found it as a reasonable length of time to notice differences and changes in the activity of the reaction.
There are several changes, which I have made to the equipment I will be using. Instead of measuring the Oxygen collected in a 25cm3 measuring cylinder, I am going to use a more precise equipment, a 50cm3 burette, which is calibrated to 0.1cm3. This not only allows me to obtain more accurate results, but it allows more Oxygen to be collected in it, as it has the capability of holding 50cm3 worth of gas. Also, rather than using a 10cm3 measuring cylinder to measure volumes of solutions, I am going to use 10cm3 syringes (which are calibrated to 0.2 cm3) since it is a much more precise form of measuring volumes.
To ensure that there is an air tight seal, so that no Oxygen produced is lost, some Vaseline could be used to seal all the connections and joints in the apparatus. Also, when setting up the apparatus, I have to make sure that I do not inject the Hydrogen Peroxide through the Hypodermic needle, when the end of the delivery tube is under the inverted burette. This is because, as soon as the Hydrogen Peroxide was injected into the conical flask, some air (with the same volume as the Hydrogen Peroxide injected from the syringe), which was in the conical flask, was displaced into the inverted measuring cylinder, due to the pressure caused by the injection of the substrate solution. As a consequence, I had accidentally included this volume of gas in my readings, which was supposed to be the volume of the Oxygen produced during the decomposition reaction, not the displaced volume of air in the flask.
VARIABLES and FAIR TESTING
To keep this experiment fair, every dependent variable should be kept constant and controlled carefully throughout the experiment. In my case the Hydrogen Peroxide concentration and the time, are the independent variables, which should be varied accordingly.
Table 4 (A Table showing the Variables and how they will be used in the Experiments)
The reliability and accuracy of the experiment is important as well as controlling the control variables, because inaccurate data will cause the outcomes of the experiment and the graph to be incorrect. To increase the reliability and accuracy of the experiment I checked the apparatus every time I did a run so the apparatus were always set up properly, therefore always giving similar sets of readings. Other points which should be considered, in order to make the experiment fair are:
- When setting up the burette, it should be positioned as much as possible to 90° to the vertical, and when measuring I have to make sure that my eyes are level with the water level and that they are at right angles to the reading. By doing this the most accurate readings can be observed and recorded. Also, when reading the graduated scale on the burette, I have to keep in account that I have to read from the bottom of the meniscus (curve).
- The balance should read zero before weighing out 3.00g of the minced potato, making the readings correct to zero-errors. Also, the same balance should be used throughout the experiment, as readings may differ from balance to balance. Also, the readings on the balance should be to 2 decimal places, which means that it is a precise weighing equipment.
- The stopclock should be positioned so that the amount of eye movement I do to check the time and then read of the water level in the burette is minimised. Hence, minimising the thinking time and allowing more accurate and precise measurements.
- The volume of the substrates injected into the flask should be kept the same, since the number of molecules has to be the same, so that the same number of collisions take place. However, not all these collisions will be resulting in an enzyme breaking down a substrate molecule, in cases involving diluted substrate concentrations, since there will be water molecules colliding with the enzymes, but not resulting in any reactions.
- Agitation (stirring) of the Catalase enzymes and hydrogen peroxide molecules can affect the rate of reaction, because stirring increases the likelihood that the substrate molecules will come into contact with the active sites of the enzymes, and thus there is more chance that the Hydrogen Peroxide molecules are broken down. Hence increasing the speed of the reaction. Since this is not the variable we are altering, as its the dependent variable, I must make sure that any agitation of the contents of the conical flask during the reaction is kept to a minimum in order to make sure that the experiment is a fairly undertaken.
- When measuring the volumes of water and Hydrogen Peroxide using the syringe, the measurement should be taken from a 90-degree angle to avoid parallax error.
FINAL IMPROVED EXPERIMENT
As a result of the preliminary evaluation, several changes have been made to the initial procedure in order for my final results to be as accurate and precise as possible. Also, now that I have considered ways to keep my final experiment as fair as possible, I can start with the final improved experiment.
Table 5 (A Table showing the Apparatus and Equipment used and the reasons for using them)
Table 6 (A Table showing the Safety Precautions required to be taken Before, During and After the Experiment)
Some extra Important Notes to Remember, concerning Safety:
- Even though the concentrations of the solutions I will be using in my experiment are not extremely harmful, precautions must still be taken.
- Hands must always be washed after handling all chemicals and solutions.
- A medical kit is needed to be at hand in the lab at all times.
-
Since I am using pH7 buffer solution as well as H2O2, I have to remember to carefully handle the chemical, so that it cannot be harmful in any way.
- Hair must be tied back, out of the way, hence ensuring that it isn’t a disturbance.
- Exits should always be clear, and there should be more than one visible, and unused stools and bags should be placed to one side, in case of an emergency.
- Lab coats should also be worn in case of spillage. This prevents clothing and exposed arms from being damaged.
The Final Improved Experiment Procedure
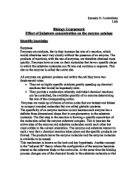
- To test how concentrations of Hydrogen Peroxide affect Catalase activity, the apparatus shown in diagram 4 was set up.
Diagram 4 (An Apparatus Diagram for the Final Improved Experiment)
- Then, 3.00g of prepared minced potato solution was measured using a digital balance and placed in the conical flask.
-
10.0cm3 of pH7 buffer solution was measured using a 10cm3 syringe, calibrated to 0. cm3, and added into the flask containing the minced potato solution.
- The flask was gently swirled in order for the two solutions to be mixed.
-
Then a thin layer of Vaseline was pasted on the inside neck of the conical flask, as shown in diagram 4, where the bung was to be placed.
- The bung with the vertical glass tube and Hypodermic needle attached into it was placed on the conical flask and secured in place by the Vaseline, assuring an airtight seal.
- Next, the delivery tube was attached to the vertical tube coming out of the bung. Again this joint was secured by the use of a layer of Vaseline.
-
Then, diagram 5, was followed to fill the tub and the burette with water, and to then carefully invert the burette (filled up to the 50cm3 calibration, with water) in the tub. A note was taken if the water level in the inverted burette was below 50cm3. The open end of the burette WAS NOT YET placed over the delivery tube, which was lying inside the tub.
Diagram 5 (A Diagram to show how to set up the Inverted Burette in the Tub)
-
Next, 5.0cm3 of the 3.0% Hydrogen peroxide solution was measured using a syringe, straight from its container, which it is stored in. This was important, because Hydrogen Peroxide has the capability of very slowly decomposing by itself: meaning risks aren’t to be taken.
-
Then, this syringe containing 5cm3 3.0% Hydrogen Peroxide solution was placed in the Hypodermic needle on the bung of the conical flask, as shown in diagram 4.
- Next, the Hydrogen Peroxide in the syringe was injected into the conical flask via the Hypodermic needle. (The advantage of using the Hypodermic needle is that it doesn’t allow much of the gas produced during the reaction to escape, but still at the same time allowing the Hydrogen Peroxide solution in, to start the reaction.)
-
Then immediately, the injected Hydrogen peroxide solution displaced a gush of air, which initially filled the space in the conical flask, out of the flask and through the delivery tube into the tub. After about 5cm3 air was displaced in the tub, the delivery tube was immediately shifted under the inverted burette, so that the oxygen being released from the reaction in the conical flask wasn’t lost and so it could be collected and measured.
- As soon as the delivery tube was placed under the inverted burette the stopclock was started and the reaction was measured over a period of 4 minutes, and at time intervals of 30 seconds, the volume of Oxygen collected in the inverted burette was recorded. The volume on the burette, which was recorded, was the level at which the oxygen had displaced the water initially present in the burette.
-
The value read from the burette, should be subtracted from 50cm3 (the initial water level in the burette, before Hydrogen Peroxide was added to the minced potato solution), to give the volume of oxygen released during the reaction. However, as mentioned in step 8, in cases where the initial water level was different and below 50cm3, then the volume of Oxygen recorded in the time intervals should be subtracted from the specific initial volume noted.
- The whole procedure from step 1 to step 14 was repeated with the other Hydrogen Peroxide concentration solutions. It is important to be careful and make sure not to contaminate the different concentrations with one another, as it would cause inaccurate results. So every time a different Hydrogen peroxide solution was made, the syringe used to inject the substrate into the conical flask, was washed using distilled water.
- The above experiment from step 1 to step 15 was repeated again at least once so that average values could be obtained. Repeating the experiment several times helps to produce better and more accurate results, as any inaccuracies in one experiment should be compensated for by the other experiments.
- Finally, all the results were recorded.