I have carried out a prior investigation. The aim of this investigation was to try and find which sugar solution yeast respired on the most effectively. We tested Fructose, Glucose, Maltose, Sucrose and starch with the yeast and found that yeast respired on sucrose better than on the other sugars. We found this because we massed the separate solutions at regular intervals and noticed that the greatest mass loss was from the sucrose solution and we took the loss in mass to be the mass of carbon dioxide (gas).
Apparatus:
Beaker, bung, one way gas filter, 1%, 5%, 10%, 15%, and 20% sucrose solution, same source of yeast, electronic scales.
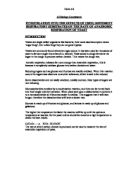
Method:
Set up the equipment as shown below. The equipment set up in the diagram below will have to be repeated five times so that all the five separate concentrations of the sucrose solutions can be tested at the same time. The sucrose solution will be added to the beaker first, and then the yeast is added to the beaker. The beakers should be labelled with the concentration of sucrose they have inside so the results don’t get mixed up. Then mass each beaker when all the reactants have been added. From then on whenever you choose to/or at regular timed intervals you should find the mass decrease note the mass of all five experiments at the same time to prevent unfair results. When you come to mass the experiment do it 3 times and then take the average so you get fairer results. You could have 5 electronic scales to gain even more accurate results, as they will all be able to be massed at exactly the same time.
A little bit of water will have to be put in the U-bend of the tube in the gas filter to stop other gasses entering the enclosed environment created by the experiment. If other gasses entered the beaker it would affect the mass, especially if water vapour entered, then cooled and formed water droplets on the side of the beaker. This means that it is possible to assume that the only reason for the loss of mass is because carbon dioxide has diffused out of the high pressure of carbon dioxide in the air space in the beaker into the air outside the beaker, which would have a lower pressure of carbon dioxide. The experiment is a safe one. There is no real danger to the observer when participating in this experiment.
The only variable in this experiment will be the concentration of the sucrose solution i.e. the amount of sugar; all the other conditions will remain constant. This means that there will be a fair test because we know that the reason for the difference in results will be because of the different concentrations. The conditions that will be kept the same are the temperature of the surroundings, the amount of yeast used in each experiment (and making sure the yeast is from the same source, the volume of water in the U-bend and obviously the equipment. The temperature would affect the results because it will speed up the reaction, as it gives the particles more kinetic energy and so increases the chance of a collision. If more yeast were used in one experiment compared to another more yeast would mean an increase in respiration, which would also affect the results (mass). If the water volume in the U-bend were larger in one experiment it would be harder for the carbon dioxide to diffuse out into the surrounding atmosphere because the barrier between the two atmospheres is larger and hence harder to diffuse across.
Diagram:
Analysis:
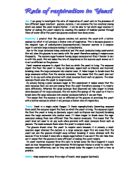
The graph does relate to the aim of the experiment because the aim of the experiment was to measure the rate of reaction by observing how much carbon dioxide was lost and as I’ve said before we will take the mass lost to be the mass of the carbon dioxide lost.
From observing the graph it is clear to see that all the lines descend this represents a loss in mass. This mass loss should equal the mass of carbon dioxide released from the experiment because the other product is a liquid and so remains in the container and hence will be accounted for when the experiment is massed. The results can also show that as the concentration rises the overall total mass loss increases; this is the case for the 1%, 5%, 10% and 15% sucrose solutions. The mass lost in the experiment using 20% sucrose solution seems to be the same if not less than the mass lost in the experiment using 15% solution. I have drawn on the graph to identify the overall mass loss more easily.
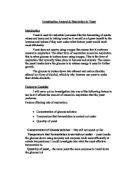
The table below shows accurately the exact overall loss in mass. As I said in my analysis of the graph I thought that the biggest overall mass loss might be noticed in the experiment using 15% sucrose solution. Up until the experiment using the 15% solution the overall mass lost rose as can be seen on both the table below and the graph. This suggests that the optimum % sucrose solution for yeast (at the quantity of yeast we used) to respire on is 15.
For the % solutions lower than 15% it is clear that there was a lower quantity of sugar that the yeast had the potential to respire on. This is because as we can observe if we increased the amount of sugar in the same volume (increased the % of the solution) we can see that the same amount of yeast respired more sugar than the lower % solution because there was a bigger mass loss hence more carbon dioxide released; which results in a more respiration taking place and at a quicker rate. More respiration-taking place can be identified on the graph as when the line levels out this means that the respiration has stopped because no mass is being lost i.e. no carbon dioxide is being released. On the graph it can be observed that as the concentration increases it takes longer for the line to level out. So as the concentration increases the more respiration occurs.
The lower the % of the sucrose the lower the amount of sugar molecules there are in the same volume and there for the chance that a sugar molecule will bump into a yeast cell and then pass through the membrane is decreased. Also the less the sugar there is the less respiration will occur because the raw material is limited. This explains the different results. Most of these explanations were listed in the prediction.
My prediction that if the concentration doubles the mass lost will double wasn’t proven to be correct apart from the case of the 5% and 10% solutions the mass loss roughly doubled this is may be because my ranges of concentration used were too big. Now seeing the results I can see why the mass lost in the 20% solution is not double the mass lost in the 10% solution, this is because the optimum concentration was about 15% so after this concentration the mass lost won’t increase. If my concentration ranges had been 2%, 4%, 6%, I may have noticed a slight difference.
From the graph we can see that the steepness of the lines increase as the concentration of the sucrose solution increases to 15%. The 20% concentration line is roughly the same steepness (if not more gentle sloping) as the line representing 15% concentration. The steepness of the line represents the rate of reaction. If the line is steep it means that the rate of reaction is quick and if it is a gentle slope this means that the rate of reaction is slower.
I also predicted the greater the concentration the more carbon dioxide will be released (the more mass will be lost). This is true up until the 15% concentration. I would have thought that the same mass would have been lost if sucrose solutions were used with greater concentration than the optimum % concentration. This is because there will still be the same amount of sugar for the yeast to respire at full potential but there will also be excess, that the yeast won’t be able to respire on in a certain time (because the amount of yeast is also a limiting factor.) The reason for the 20% solution overall mass loss being less maybe because the rate of reaction in the 15% solution was increased due to the increased movement to this experiment giving the sugar molecules more kinetic energy or the 15% solution gaining more sunlight and hence heated more which would also have given the sugar molecules more kinetic energy.
My results have been backed with my original theories.
Evaluation
I feel my plan did succeed as I managed to predict the results with a reasonable degree of accuracy and also gave good detailed theories supporting my prediction. I also feel that I’ve constructed the method so that it is easy to understand and easy to carry out the investigation.
I was able to show that as the concentration of the sucrose solution increased the amount of respiration occurring increased up until a certain point, which was 15% sucrose solution, beyond this concentration the overall mass lost decreased a tiny bit, this indicates that the amount of respiration occurring decreased. However this doesn’t prove that if I tested a 25% solution in the same experiment that the mass loss would be even less, it could be the same as the mass lost for the 15% concentration experiment. I will need to extend the investigation using higher concentrations to identify a trend here.
The readings were accurate as we massed the experiment (solution in beaker with bund and gas filter) three times at each time it came round to finding masses then the average was taken, so the results would be accurate. Also we used electronic scales so the readings would have been accurate.
I did encounter a few anomalous results. They were all similar though. One of these similar anomalies was that between the first and second day of the experiment the mass lost for the 1% concentration solution was 1.61g and the mass lost for the 20% concentration solution was 0.45g. Because generally the rate of reaction for the 20% concentration solution was quicker than the 1% concentration solution this result wouldn’t be expected. When I say similar I mean that one or two other anomalies like this one solution that had an overall quicker rate of reaction has a lower mass loss (between 2 days only) than a solution with an overall slower rate of reaction. Some possible reasons for this maybe error in writing down mass, one was left in more sunlight than another, one was shaken more than the other, (the previous two would both increase the kinetic energy given to the sugar molecules and would increase the chance of one bumping into the and entering the yeast cell).
I think the procedure we chose to investigate the rate of respiration of yeast in different concentrations of sucrose was suitable as the only variable was the concentration; therefore the difference in results is due to the change in concentration. So it was a suitable procedure that was carried out.
I think that the investigation was very reliable and that the results are gathered and interpreted were enough to base my conclusion upon. Maybe to improve the experiment we could put the five separate experiments into the same water bath ensuring that they are all at the same temperature. However in doing this I’m sure the results would be very similar if not exactly the same.
As I said earlier I could extend the investigation by investigating the total mass loss when % concentration solutions above 20% are used; to see whether the overall mass loss increases, decreases, or stays the same when the concentration is above the optimum concentration. I would probably predict that the rate of respiration and amount of respiration occurring would be less than in the 15% sucrose solution because I have found out that as the concentration rises above the optimum concentration the rate of reproduction of the yeast cells decreases, so there will be less respiration occurring as there is less yeast cells. I could keep the same concentration and the same amount of yeast and the variable in this investigation could be the pH or the temperature. I would expect a pattern to emerge with the temperature as enzymes that would breakdown the sugar in the solution would denature and so respiration wouldn’t be able to occur because glucose won’t be present. The pH would also effect the results as different enzymes have different optimum pH’s. Also different amounts of a catalyst could be added, however this would be very difficult. Other possibilities could include the variables being different concentration/quantities of yeast, or different types of sugar solutions at the same concentration.