Build an effective sensing circuit that will be able to measure changes in light levels using an LDR.
Sensors Project
Aim
To build an effective sensing circuit that will be able to measure changes in light levels using an LDR.
Safety
* All wires should be checked that they are properly insulated to prevent electric shocks.
* The voltage should not exceed the recommended manufacturer's limit for the resistors and bulbs used to prevent over heating or component damage.
* Careful observation should be made to ensure no incorrect connections that could possible cause a shorted circuit.
* Power pack should be fitted with a fuse and safety cut-out button.
* Clear work area
Apparatus
* 12V Power Pack
* 3V Battery Pack
* 6 Leads with crocodile clips
* Voltmeter
* Ohmmeter
* Ammeter
* 5W, 24W, 36W and 48W bulbs
* LDR
* Rheostat
* Black tubing
Development
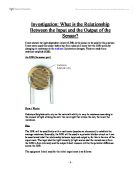
To see how much the resistance of the LDR varies as light levels change I first made a small experiment to look at the actual resistance value changes.
The distance between the LDR and the base of the bulb was kept constant, at 25.6cm. The bulb length for the majority of the bulbs was 5.8cm, although the 5W bulb had a much shorter length and so the difference in distance had to be accommodated for. I first took a reading without a bulb to see what the resistance value of the LDR would be in normal light levels. To check the readings I repeated each test three times and then took an average of the three values. Below is a diagram of the first experiment.
Below is a table of results from the experiment:
Bulb Wattage (Watts)
Resistance of LDR in k? (1)
Resistance of LDR in k? (2)
Resistance of LDR in k? (3)
Resistance of LDR in k? (Average)
0
76.6 +/- 0.1
76.2 +/- 0.1
76.8 +/- 0.1
76.5 +/- 0.1
5
.61 +/- 0.1
.59 +/- 0.1
.63 +/- 0.1
.62 +/- 0.1
24
.2 +/- 0.1
.2 +/- 0.1
.25 +/- 0.1
.22 +/- 0.1
36
0.96 +/- 0.1
0.95 +/- 0.1
0.95 +/- 0.1
0.95 +/- 0.1
48
0.6 +/- 0.1
0.57 +/- 0.1
0.58 +/- 0.1
0.58 +/- 0.1
As you can see from the table the different wattage bulbs produced a significant difference in resistance of the LDR.
The graph produced a negative correlation, showing that as the wattage of the bulb increased, the resistance of the LDR decreased.
Here I expected a linear relationship because if the bulb wattage doubles, then the energy outputted from the bulb in joules would double also and so the light intensity would double, therefore halving the resistance value. However, a good relationship couldn't be produced as the amount of values was very limited due to a small range of bulbs with different power ratings.
As the choice of bulb wattage was limited, I decided to add a rheostat to the circuit to enable me vary the voltage across the bulb and so the amount of light being produced. I also added an Ammeter and a Voltmeter so that I could calculate the bulb power using the equation:
Electrical Power Used by Bulb = Voltage X Current
Below is a circuit diagram of the changed circuit.
Here, the rheostat was moved up and down to change the resistance in the circuit, this allowed me to have many different power ratings ...
This is a preview of the whole essay
As the choice of bulb wattage was limited, I decided to add a rheostat to the circuit to enable me vary the voltage across the bulb and so the amount of light being produced. I also added an Ammeter and a Voltmeter so that I could calculate the bulb power using the equation:
Electrical Power Used by Bulb = Voltage X Current
Below is a circuit diagram of the changed circuit.
Here, the rheostat was moved up and down to change the resistance in the circuit, this allowed me to have many different power ratings of a bulb, without having to change the bulb itself. The voltage was measured across the bulb and the current in the circuit was also measured to enable me to calculate the power of the bulb. Again, the distance of the bulb was kept at the same length throughout the experiment and each test was repeated 3 times. Only the averages of these values are shown in the table below to allow the table to fit on one page for easy comparison making.
Below is a table of results for this second experiment.
Current (Amps)
Voltage (Volts)
Electrical Power Used by Bulb (Watts)
Resistance of LDR in k?
2.82 +/- 0.01
8.4 +/- 0.01
23.69 +/- 0.01
0.6 +/- 0.03
2.72 +/- 0.02
7.9 +/- 0.01
21.49 +/- 0.02
0.65 +/- 0.01
2.45 +/- 0.01
6.53 +/- 0.02
6.0 +/- 0.01
0.97 +/- 0.01
2.11 +/- 0.02
4.82 +/- 0.01
0.17 +/- 0.01
2.15 +/- 0.02
.87 +/- 0.03
3.8 +/- 0.01
7.1 +/- 0.02
5.3 +/- 0.01
.7 +/- 0.02
3.15 +/- 0.01
5.36 +/- 0.01
0.3 +/- 0.02
.6 +/- 0.01
2.8 +/- 0.01
4.48 +/- 0.01
6.8 +/- 0.02
.52 +/- 0.01
2.5 +/- 0.02
3.8 +/- 0.01
26.2 +/- 0.01
.45 +/- 0.02
2.25 +/- 0.01
3.26 +/- 0.01
36.2 +/- 0.01
.4 +/- 0.02
2.06 +/- 0.01
2.88 +/- 0.02
56.6 +/- 0.01
The graph here produced a curve with a negative correlation. This showed a similar relationship to the first experiment.
I also wanted to see how the distance between the bulb and the LDR would affect the resistance of the bulb. I decided to produce another experiment that would give me many values as the distance can easily be changed. The bulb was moved away from the LDR in 5cm increments, and each time the LDR resistance was taken. The bulb wattage was kept constant at 48W. Again, for accuracy, each test was repeated three times and an average of the three values was taken.
Here I would expect a relationship where as the distance of the bulb away from the LDR is increased, the level of light hitting the LDR decreases and so the resistance of the LDR increases.
Below is a table of results for the experiment.
Distance of Bulb Away From LDR(cm)
LDR Resistance in k? (1)
LDR Resistance in k? (2)
LDR Resistance in k? (3)
LDR Resistance in k? (Average)
No Bulb
0.72
0.70
0.73
0.72
0
0.10
0.11
0.11
0.11
5
0.16
0.19
0.17
0.17
0
0.31
0.26
0.28
0.28
5
0.38
0.38
0.37
0.38
20
0.47
0.43
0.44
0.45
25
0.51
0.51
0.51
0.51
30
0.58
0.56
0.54
0.56
35
0.60
0.59
0.59
0.59
40
0.63
0.61
0.61
0.62
45
0.63
0.64
0.65
0.64
50
0.68
0.67
0.64
0.66
55
0.67
0.67
0.67
0.67
60
0.69
0.66
0.68
0.68
65
0.68
0.69
0.68
0.68
70
0.70
0.71
0.69
0.70
75
0.72
0.69
0.70
0.70
80
0.71
0.72
0.71
0.71
85
0.73
0.72
0.70
0.72
90
0.74
0.72
0.71
0.72
Here, the graph overleaf produced a curve with a positive correlation, showing that as the bulb got further away from the LDR, the light levels hitting the LDR decreased and so the resistance of the LDR increased.
By looking at the results in the table I found that the results follow the inverse square law. Where:
Energy Hitting LDR 1/Distance From Bulb²
I tested this relationship with some values from the table.
E 1/5² = E 0.04
E 1/10² = E 0.01
E 1/20² = E 0.0025
Here, each time the distance from the LDR was doubled, the energy hitting the LDR was proportional to a quarter of the previous value. As the bulb is of a spherical shape, the amount of light given off from the bulb will be equal to 48J / 4?r². Therefore, the energy twice as far from the bulb is spread over four times of the area, and so is a quarter of the intensity.
As the bulb got further than 90cm away however, the difference between the resistance of the LDR and normal light, and with the bulb, became negligible. Because of this I decided to repeat the same experiment, but with the bulb and the LDR in a black tube, to prevent any light not coming from the bulb from affecting the results.
Below is a table of results for the experiment.
LDR Resistance in k?
Distance Of Bulb Away From LDR (cm)
0.424
0
0.566
5
0.77
0
0.893
5
.09
20
.328
25
.549
30
.806
35
2.069
40
2.375
45
The graph overleaf produced a straight line with a positive correlation, this showed that the relationship between distance of the bulb and the LDR resistance was linear. It also showed that by using a tube with the bulb and LDR the curve caused by natural light was removed.
To try and find out with what circuit the LDR is most effective I changed the circuit to include a resistor. I then measured the change in voltage across that resistor, as the bulb was moved away from the LDR.
Below is a circuit diagram of this experiment.
Again, the bulb wattage was kept constant at 48W, and the bulb and LDR were both inside a black tube to block out light from sources other than the bulb.
The bulb was moved in 10cm increments, up to a maximum of 50cm away. This was a limitation due to the length of the black tube. After taking readings at each distance, I changed the resistor value to try and find out which resistor would make the most efficient light sensor with the LDR.
Below is a table of results for this experiment.
Voltage Across Resistor
Resistor Value in k?
Distance of Bulb Away From LDR
2.32
0
.84
20
.47
30
.17
40
0.93
50
2.61
2.2
0
2.31
2.2
20
2
2.2
30
.72
2.2
40
.44
2.2
50
.9
0.47
0
.29
0.47
20
0.91
0.47
30
0.7
0.47
40
0.55
0.47
50
.39
0.22
0
0.8
0.22
20
0.53
0.22
30
0.38
0.22
40
0.29
0.22
50
2.76
4.7
0
2.58
4.7
20
2.4
4.7
30
2.22
4.7
40
2.04
4.7
50
2.05
0.56
0
.44
0.56
20
.05
0.56
30
0.83
0.56
40
0.67
0.56
50
Voltage Across Resistor
Resistor Value in k?
Distance of Bulb Away From LDR
2.13
0.68
0
.6
0.68
20
.21
0.68
30
0.94
0.68
40
0.78
0.68
50
2.22
0.82
0
.64
0.82
20
.28
0.82
30
.04
0.82
40
0.86
0.82
50
To find the resistor that produced the most sensitive light sensing circuit I calculated the differences in voltage for each resistor. The circuit with the
k? resistor had the highest voltage difference, with a maximum of 2.32 Volts when the bulb was 10cm away from the LDR, and 0.93V when the bulb was furthest away at 50cm.
Conclusion
From the tests made I have been able to make the following conclusions:
* I found that, as predicted, the higher the wattage of bulb the more light emitted and so lower the resistance of the LDR.
* This is due to there being are a larger amount of light hitting the LDR with a high wattage bulb there being a larger amount of electrons released and so the current is larger.
* I also found that as the bulb was moved further away from the LDR the resistance of the LDR increased. When a resistor was used in the circuit the voltage across this resistor decreased as the bulb was moved further away.
* This was due to there being a smaller amount of light reaching the LDR, when the bulb was further away, so there were fewer electrons being released and so a smaller current and voltage, and a larger resistance.
* The energy twice as far from the bulb is spread over four times of the area, and so is a quarter of the intensity.
Evaluation
Throughout the experiment the results produced were all close to my predictions, and there were few anomalous results in the tests made.
Each test was repeated three times and then an average taken of the three values to improve accuracy of results. In almost all of the results, the values recorded never fluctuated more than 5%, although by using an analogue meter instead of a digital one this problem could have been eliminated.
One of the main problems with the tests I made was the background light interfering with the results. Also, as some of the tests were repeated or continued on different days and at different times of day the background light levels would have changed, and so would have affected the results slightly. If I were to do the experiments again I would conduct all of the tests in a room where there could be no background light to interfere with results. This would also mean that the level of light would always be the same whatever the time of day or weather conditions.
Another problem with the first tests was that the range of bulbs was small, and the bulbs used varied in size. This meant that the distance from the LDR to the bulb could not be as accurately measured compared to if the experiment was done with same sized bulbs. If I were to do the experiments again I would try to use a large range of bulbs that were the same length.
Also, when measuring the voltage across a resistor in one of the circuits the value of the resistor was always taken to be the manufacturers specified reading. However, this meant that as the resistor values can be 10% +/- the manufacturer's specification the comparisons between the different resistors may not have been accurate. If I were to do the experiments again I would use an ohmmeter to get the exact reading of each resistor to use to make sure that any relationships or comparisons made were completely accurate.