Measurements taken of: Time, extension
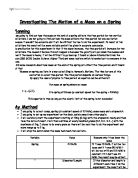
Diagram
- Set up clamp stand to the correct height over the edge of a table
- Place the 2 large weights on the flat part of the clamp stand, as shown in the diagram
- Measure the length of the spring 3 times and record in the unloaded length of spring table
- Hook spring onto the edge of the clamp stand as shown and secure with the elastic band
- Put on safety glasses
- Place loaded weight hook on the bottom of the spring
- Measure the length (making sure that the line of site is at 90 degrees to the rule) of the spring
- Reset the stopwatch
- Carefully pull the weight hook down 5cm and let go
- When the spring is vibrating steadily and in a vertical motion, start the stopwatch
- When 10 cycles (up and down) have passed stop the stopwatch promptly
- Repeat each mass 3 times and then take averages
- Record results in tables with the following format:
Graph information
Reasons for choice of design using preliminary work
I completed some preliminary work before doing my actual experiment. The preliminary work allowed me to choose the type of spring, the type of mass and the range of masses and amplitude and number of oscillations that my experiment should have.
Spring – There were two types of spring that I could choose from – a long thin spring (average 5mm diameter, 100mm length) or a short, wide spring (average 11mm diameter, 21mm length). I chose the short, wide spring because when the masses were placed on the longer spring they were more prone to falling off and this may have been a safety hazard.
Mass – There were two types of mass that I could have used – 100g masses and 50g masses. I decided to use the 50g masses because after placing seven 100g masses on the short spring it stretched so much that when I allowed it to oscillate it reached its elastic limit and failed to oscillate with simple harmonic motion. I could place nine 50g masses on the spring (450g) and the spring still oscillated with SHM and did not reach its elastic limit.
Range of masses – I tested the highest and lowest masses to reach a conclusion about the range of masses that I was going to use. I tested to see whether the masses made the spring reach its elastic limit at the highest mass and whether the mass fell off the hook at the lowest mass. I decided that the range of masses from 50g to 450g would give me enough results to plot an accurate graph with and 450g did not cause the spring to reach its elastic limit.
Number of oscillations – I chose the number of oscillations to be 10 because the more oscillations, the more accurate the result will be. 10 Oscillations were not too much because I originally tried 15 oscillations. 15 oscillations with 50g mass did not work because the oscillations stopped before 15 oscillations had passed, I tried 10 oscillations and this seemed to work.
Amplitude of oscillations – The amplitude of oscillations must be large enough to keep the SHM going for at least 10 oscillations, I tried quite a range of oscillations but decided on 50mm because above that was too much and the mass sometimes left the spring, causing a safety hazard and below that made the oscillations too hard to count, as they went too fast and this would have made me lose accuracy in my results.
Safety glasses must be worn as a precaution, in case the weight hook, along with the weights falls off in the middle of a cycle.
Results
Graph information
Graph
The gradient of the graph:
y 2 – y1
x2 - x1
0.585-0.1
140-24
0.485
116
gdt= 0.0041s/mm change to metres – x10-3 = 4.18 seconds/metre
g=4π2
grad
g=4π2
4.18
g=9.44N/Kg
According to my experiment, gravitational field strength is 9.4N/Kg.
Sources of error
There may have been a systematic error in the stopping of the stopwatch at the exact point at which it needs to be stopped, random error may have occurred in reaction times. Another error, which may have occurred, is in the measuring of the length of the spring when masses were added. The rule must be exactly at 90 degrees to the line of site to get an accurate reading.
Percentage errors
To calculate my percentage errors I have taken the accuracy of the concerned equipment and divided it by an average of the values that have been produced by the piece of equipment. I have then multiplied this by 100 to give me a percentage.
There may have been experimental errors in the stopwatch accuracy:
0.1
6.44
=1.55% error
This error would have doubled because of the squaring of T
=3.11% error
This is quite high and if I were to do the experiment again I would use an electronic recording device to record the results.
There may have been experimental errors in the measurement of the length of the extension:
1.0
103
=0.97% error
The total error for my experiment is 3.11 + 0.97 = 4.08%
From my experiment I calculated that g was 9.4N/Kg. 4.08% of 9.4 = 0.4
Taking this into account the actual value for g could be 9.4 ± 4%
= 9.4 ± 0.4
This gives a range from 9.0N/Kg to 9.8N/Kg
The real value of g is 9.8N/Kg
This value is some way off my original, predicted value but this may have been because I didn’t think that my sources of error would be so significant. The total error calculated above may not be the real total error, as I haven’t taken into account reaction times or other systematic errors.
The most significant measurement was the time period as this had to be squared, therefore the most significant error was the time period because squaring an error doubles it.
The value that I got for g may not have been accurate because of the % errors and reaction times and so may not be a very reliable result.
To help minimise errors, an electronic recording method to record the results would have increased the accuracy, because of the lack of reaction time. A stopwatch with increased accuracy may have also helped.