MATERIALS:
METHOD:
PROCEDURE:
-
The aforementioned apparatus should be arranged in a suitable arrangement, as shown in Appendix A.
-
The decided water quantity (100cm3) must be measured. This must then be placed inside the copper pot and a thermometer placed in the water, so it can adjust to the temperature of the room and the water.
- A spirit burner containing the desired alcohol for testing, with its lid on should be weighed and its original mass noted. This step must be repeated for all alcohols that are to be tested.
- The distance between the base of the suspended copper pot and the wick of the spirit burner should be measured and should remain constant for all repeats.
- The spirit burner should be lit and then the alcohol must burn with Oxygen until the water volume experiences a 10˚ temperature increase.
- The spirit burner lid must be replaced to extinguish the flames when this temperature rise is achieved. The spirit burner mass should now be recorded again.
- This procedure must be repeated for all the different alcohols in its entirety.
- Furthermore, the experiment must be repeated at least three times for each separate alcohol, to ensure a fairer representation of the experimental values.
- The experiment must then be attempted with the use of a calorimeter in place of other apparatus, to discover the impact of air current and incomplete combustion, as well as other imperfect conditions on the experiment.
- If there is sufficient time, to obtain fairer results, the procedure using the calorimeter must be repeated for a total of three attempts.
SAFETY:
- Alcohols are being used and are extremely flammable. For this reason, fire retardant lab-coats should be worn and long hair tied back. Furthermore, all paper and material should be on a separate bench during the combustion process. This will lower the risk of a fire hazard.
- Eye protection should be worn, as alcohol can be an irritant to the eyes. Also, water if approaching boiling temperature may ‘spit’ and cause irritation.
- Workers should remain standing at all times, in order to avoid knocking over any apparatus and to allow quick escape should anything catch alight.
- As a further precaution, water will be measured away from active terminals.
- In the case of a fire, a sand bucket, or fire extinguishing mechanism must be on hand and accessible at all times. Fire exits must remain unobstructed.
FAIR TESTING:
- To create a fair test, the environment should be the same for all experiments and repeats. This involves the replication of conditions, such as having all windows closed or open and breathing on or away from the flame invariably.
- The distance between the wick and the base of the copper pot must remain constant, as otherwise this will allow a greater or a lesser efficiency of heat transfer and will make results bias.
- The same material should be used for preferably all apparatus, but especially the copper containment pot, as this will greatly affect heat transfer efficiency.
- Water volume, source and temperature increase must remain constant, as otherwise this will not produce a comparable set of results.
REASONING:
- The aforementioned method will be likely to deliver reliable and interpretable results. This is because:
- The three results for each alcohol under the different circumstances will provide a valuable and fairer representation of the actual enthalpy value and will counter some of them lesser anomalies, as well as identifying those still present.
- Furthermore, the extensive form of testing will isolate anomalous readings and allow these to be analysed by comparison of conditions between the original experiments and the repetitions of these procedures.
- The extensive variety of results will allow more evidence to be processed toward proving or disproving the original hypothesis.
- In each case of experimental repeat, the conditions of procedures that are producing results that must be analysed; will be performed in identical environments.
HYPOTHESES:
PREDICTIONS:
Before undertaking my experiment, I will attempt to make logical and detailed predictions relating to my investigated variable. These include:
-
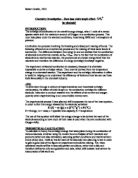
I believe there will be a relationship between chain length and ∆Hcθ. This is because the combustion of alcohols involves both an endothermic and exothermic stage. The ignition with activation energy of a lighted splint begins the endothermic breaking of bonds within the alcohol. This is a self-perpetuated combustion, which is followed by the exothermic formation of both Carbon Dioxide and Water. In this case the energy level of the products is lower than that of the reactants. This means that heat is given off the surroundings, making the value of ∆Hcθ negative and thus the experiment exothermic. This can be shown as a graph:
Enthalpy (H)
Reaction Pathway
-
Therefore I predict that longer chain length alcohols will give out more energy and thus have a lower enthalpy value. This will be caused by the increased formation of CO2 and H2O molecules, which will increase the negativity of the Enthalpy change.
- Furthermore, I predict that the relationship between chain length and enthalpy negativity will be non-linear, due to the single and undeviating –OH group of alcohols in relation to the constant increase of C-C and C-H bonds.
- I also predict a greater error margin for larger alcohols. This is because they have more bonds, and due to the bond enthalpies being estimations (enthalpy cannot be directly measured) they may cause greater inaccuracy.
FACTORS:
As part of my hypothesis, I believe it is important to predict the possible effect and magnitude of factors, which will affect results under imperfect conditions. These include:
-
Draught/air current – Despite an enclosed environment, air current will still be present due to: open windows, doors, people moving and people exhaling. I predict that air currents will cause a less efficient rate of heat transfer between the spirit burner flame and the water.
-
Oxygen richness – The experiment involves combustion, which to be complete requires a certain Oxygen atmospheric richness. Therefore, if there is a lack of Oxygen in the air surrounding the flame, incomplete combustion may occur. This will cause the enthalpy value to be inaccurate due to inefficient heat transfer.
-
Equipment inaccuracy – Much of the equipment within the lab, including measurement devices, can be inaccurate. This is due to the fact that certain instruments, such as the top-pan balance measure only to several decimal places. These errors combine to affect the overall results in a potentially profound way.
-
Apparatus problems – For varying reasons, much of the apparatus used will create a problem in the experiment. This is largely due to the desired variable and such problems will include:
- Lacking efficiency for heat transfer due to the use of a copper pot (copper is a metallic and highly thermally conductive material).
- The metallic nature of other equipment, including the boss-head, clamp and stand may also damage results, due to their high conductivity as metals.
-
Impure alcohols/ethers – In isomerised alcohols (ethers) the –OH (hydroxyl) groups are in different positions. The enthalpy varies between the isomers due to the position of the OH section. Therefore to counteract this, the alcohols must be pure and in the form: X-1-ol; eg- Butan-1-ol.
-
Water temperature – The initial water temperature must be kept low (preferably at 25˚C). Otherwise the water could boil and then gauging the energy transfer is far more difficult and less accurate with given apparatus.
-
Isomerism – Alcohols such as Propanol and Octanol, among others, have long enough carbon chains to form isomers (ethers) and due to the polar nature of alcohols and their hydroxyl groups, all those alcohols that can form isomers must be in the form X-1-ol (where X is the appropriate prefix).
-
Purity of alcohols – If alcohols are impure due to mixture with water, they must not be used. All alcohols must be pure for fairness.
RESULTS:
Below (Figure 1) is a table of results that shows the temperatures of the water at the start and end of the combustion experiment with a fixed and constant volume of 100cm3. Results that are considered anomalous, regarding the mass of the alcohols are highlighted in various colours for reference.
Figure 1
From the original table of results (Fig. 1), which shows only mass changes, it is possible to deduce the moles of fuel used on average. This was done by first taking the average mass of the fuel used over the four attempts to create a fairer display accounting for some variations, and then using the molar formula. By dividing the average mass by the molecular (formula) mass, the number of moles used can be calculated.
Figure 2
Furthermore by using the derived mole number, the experimental enthalpy can be found. This is done by first using the aforementioned energy equation to work out how much energy was used to heat 100cm3 of water up by 10C taking into account its specific heat capacity. Hence:
Energy (E) = Mass (m) x Specific Heat Capacity (c) x Temperature Increase (θ)
E = 100g x 4.2J˚C-1g-1 x 10 (˚C) = 42000J
In order to work in the desired kJ units, this figure must be divided by 1000.
42000/1000 = 42kJ. Due to the fact that the enthalpy in terms of the reactants is negative, this figure must be represented as a negative change, so that the enthalpy of combustion will have the necessary negative figure.
The table below contains the calculated constant energy change and the calculated number of used moles. In a simple division (E/mol) the energy (kJ) per mole can be calculated, as below:
Figure 3
(The above values have been plotted as a graph in Appendix D).
ANALYSIS:
To order evidence and establish trends, both graphically and statistically, I must first use the various analytical and mathematical tools at my disposal to establish and numerical trends, which I can then account for in my conclusion.
ERROR FACTOR:
In order to address the level of error, I have placed in a table the calculated enthalpies, the experimental results for enthalpy and the factor of their difference.
Figure 4
CORRELATION CO-EFFICIENT:
Correlation is the measure of how strong the relationship between two variables is, given in the form of a single number that is –1 or above, but no greater than 1. In this case –1 represents zero correlation and no relationship, 1 represents a perfect and linear relationship and 0 represents mediocre correlative variables. By using this method, I can check my theoretical figures and thus prove that the relationship between Carbon chain length and Enthalpy is not linear, but is of a very strong correlation. The correlation co-efficient for chain length and theoretical enthalpy change (worked out using Excel’s function) is: 0.999999
Furthermore, using this mathematical tool, I can work out the correlation between the chain lengths and enthalpies of my experiments. I can then compare this figure with my theoretical correlation to gain a fair representation of inaccuracies when experimenting. The actual correlation from my results is: 0.990235
GRAPHICAL ANALYSIS:
From my graph a number of things can be done to aid me in my conclusion. By drawing a curve of best fit, I am able to establish the curved line that shows best the trend of my results. Furthermore, I can isolate anomalies from this graph and label them for evaluation as to their cause and magnitude.
From my curve I can also find the gradient at two separate points (by drawing a tangent to the curve) and prove there is a changing rate of increase and thus that the relationship is not linear.
The graphs in Appendix B and C can be compared in terms of gradient and anomalies, to show the effects on the results when the experiment is performed or calculated in theoretically perfect conditions.
ANOMALY SELECTION:
Due to the imperfectly controlled nature of my experimental results, I always expected anomalies due to various factors. For this reason, I believed that having a method of selecting anomalies was appropriate.
For this experiment, I reviewed my results and decided that I would only investigate those anomalies which had a + or – deviation of 25% from the averaged mass. To work out the percentage differentiation, I divided 100 by the original result from the table and then multiplied this by the averaged mass. I then subtracted 100 to find the increase or decrease in percentage and thus the difference. Eg-
(100/0.42) x 0.53 = 126.2 / 126.2-100 = +26.6% differentiation - ANOMALY
This allowed me to both be selective, allowing for the expected error margin, as well as address a number of anomalies that are suitable.
CONCLUSION:
With the use of my Results and Analysis, I am able to draw a viable conclusion relating to the original question of how Carbon chain length affects the combustion enthalpy of alcohols and how and why this happens.
In relation to my hypotheses, it seems that my prediction of the non-linear relationship was satisfied by all of my results, due to the increasing negativity of enthalpy with chain length. It seems the increased negativity was a product of both the unchanging hydroxyl group and the increased product enthalpy caused by greater production of CO2 and H20 molecules.
As the Carbon chain length in alcohols (and thus the molecular mass) increases, the enthalpy change becomes of a greater negativity. As molecular mass of the alcohol increases, it has more bonds, creating a larger reactant enthalpy. However, the increased negativity is due to the fact that to balance the equation, more CO2 and H20 molecules are needed, and while more O2 molecules are also needed, the bond enthalpies, particularly for O=C=O bonds equates as greater for the product enthalpy. Thus there is an increasing rate of increase for the overall negativity of the enthalpy.
It is also feasible to draw from my graphs; the fact that the experimental plot is more appropriated to a curve of best fit, whereas the theoretical enthalpies was better suited by a line, that there is a far greater potential for anomalies during the imperfect experimental procedure.
It seems also true that inaccuracies in measurement of net energy release increase with the Carbon chain length. This is evident in Figure 4, which demonstrates steady deviation and then an increasingly large deviation. This contradicts the theoretical figures, which gave slightly deviating, yet consistent increase factors. Yet, this could be due to my prediction that when there are more bonds in larger alcohols, the lack of accuracy in the estimated bond enthalpies has a greater impact, particularly following calculations of the mole.
As expected, using the analysed figures for correlation co-efficient, it is clear that there is slightly more inconsistency with the experimental increase in negativity than that of the theoretical calculations. Such inaccuracies may be due to the factors mentioned in the plan. The correlation differential is only minor, due to the nature of correlation assessing any relationship, which in similar conditions for all fuels will always be present.
The calculated enthalpies and my experimental enthalpies all had non-linear increases, which; as I predicted, was possibly due to the hydroxyl group remaining single and constant, as the other bonds increased.
I failed to predict, also, the inaccuracies caused by alcohol polarity. Due to the varying electronegativities of Carbon, Oxygen and Hydrogen atoms, larger molecular structures are more effected, as there is greater net attractive force between the many bonds and thus more energy is needed to break them apart. Enthalpy is not only the energy needed to break a physical bond, but also the attraction between atoms sharing the bond. Therefore it was wrong to not consider the factor of alcohol polarity, which would alter the enthalpy values in all cases.
It is also possible to extrapolate, with furthered understanding the homologous general formula for alcohols, this being CnH2n+1OH. This allows for a better understanding as to why the relationship is non-linear.
Whilst general conclusions can be drawn, an exact one is difficult to make, due to the generally large amount of problems in the procedure. It is unrealistic to try and deduce a formula that would allow the extrapolation of any homologous alcohol enthalpy, due to the predicted nature of the bond enthalpies themselves and the unavoidable flaws in even professional circumstances with such an experiment.
EVALUATION:
PROCEDURE:
In evaluation of my procedure, I believe it was competent and adequate, allowing me to obtain the necessary evidence to prove or disprove my various theories. Using five alcohols seemed a good idea and gave me a decent range of results to make analysis. My apparatus setup was well informed and I did not encounter any hazards during the experiment, aside from a neighbouring group dropping a thermometer. However, proper safety procedure was followed in removing the mercury. Yet, if I were to repeat the experiment I would make various adjustments, including:
- Use a fume cupboard, rather than the Perspex draught proofing screens, as this would provide better conditions.
- Have the wick closer to the copper calorimeter, both to increase the rate of heat transfer and the efficiency, as this would prevent such massive heat loss by convection currents.
- Only use wicks of constant diameter, as this would prevent the wick size from becoming a factor, because greater area = more efficient heat transfer.
-
Attempt to take 5th repeats for all 5 alcohols, to try and eliminate the impact of anomalies more effectively.
- Have the thermometer suspended in the calorimeter at exactly the mid-height, to ensure that it did not measure the temperature of the copper.
- I would attempt to somehow measure the wasted energy from the flame as light and make appropriate adjustments to the calculation stage.
(Adjustments mentioned shown in Appendix E setup)
ACCURACY:
The experimental accuracy of my procedure, due to the many factors that could cause deviation was a critical part of my investigation. Firstly the accuracy of the apparatus used for measurement was of critical impact to the experiment, as the below table of apparatus and accuracy demonstrates.
As the table shows, the accuracy of the equipment used can have a profound impact on the final result, particularly following many stages of calculations. Therefore, as predicted, the equipment was a limiting factor on accuracy, as the example below demonstrates.
Calculated mass change of Methanol = 1.82.
Mass change if errors were always –0.005 on balance = 1.815
Moles used = Mass/Mr =1.815/32 = 0.056719.
Energy change if thermometer and balance are out by –0.05 and 0.005, respectively
= 4.2(J˚C-1g-1) x 9.95˚C x 99.995g = 41788J/mol = 41.788kJmol-1
Therefore, -41.788kJmol-1/0.056719 = -736.75kjmol-1
Compound error = -738.5 + 736.75 = -1.75 = -0.237%.
This is evidence that even without incorporating rounding errors to the equation, there is a fair large error margin due to equipment alone, which damages the reliability of results. However, provided the error percentage is below 1%, results can still be considered very reliable for trend investigation and making general conclusions. More reliable equipment could be used if there was necessity for greater accuracy, such as a balance that measured to more decimal places and a thermometer with more precise reading scales.
RELIABILITY:
Data reliability within the experiment can be assessed as the result of both chemical anomalies and procedural errors. During the experimental, calculation and procedural stages there were many problems and imperfections that would have affected the final results.
- The polarity of alcohols and the electronegativities of Oxygen, Carbon and Hydrogen and its affect on bond strength was not accounted for. This would likely differ between the larger and smaller molecules, as some would have more bonds to break and so the cumulative energy needed to part the charges would have an increasing impact. Therefore, only enthalpy of bond breaking was measured, rather than total separation of two atoms.
- The calculations stage does not account for the fact that the fuels (alcohols were in a liquid form). Therefore, the vaporisation energy needed to convert the substance from liquid to gas and also the energy to make this gas expand was neglected during calculation.
- Light and other waste energy from the flame is not measured and so the total energy used is not known exactly.
-
Bonds enthalpies themselves are estimated and so are not entirely reliable in calculation. This is because while C-O bonds average at an enthalpy value of 358kjmol-1, through experiment it is known that C-O in Methanol has an enthalpy (H) of 336kJmol-1.
FACTORS:
It seems that many of my predicted factors had an effect on the experiment, despite my efforts to prevent them, and some in a more profound way than I had expected, particularly in terms of heat transfer problems. I believe that I failed to account for the great impact convection currents and draught in the room would have. The majority of heat transfer was by convection, which is the transference of kinetic energy from particle to particle in the vicinity of the flame (the thermal energy being transferred during collisions of these particles once they are ‘excited’). This means that even mild exposure to draught would cause excited particles to be constantly forced from the vicinity of the pot, as would the flame itself.
Furthermore, loss of wasted energy, by light (infra red radiation) and possibly sound from the flame is unaccounted for, but has a definite impact. No system is 100% efficient and so whatever deviation the inefficiency would cause, should be accounted for and noted as a factor in the net inaccuracy.
There is also the problem that the copper calorimeter is a metal and thus a prominent thermal conductor. Due to the free electrons passing between the copper atoms, the heat flow would be far more efficient due to the container. Also, the fact that the thermometer rested on the base of the pot meant that the conductivity of the copper may have had a greater impact than anticipated, as the thermometer would not have measured ambient water temperature, but rather that of the calorimeter.
(Appendix F shows the impact of the mentioned factors).
These problems could be solved in a future investigation through the use of a bomb calorimeter, which would remain completely enclosed and unaffected by draught, would minimise heat lost through radiation better than a simple foil coating and would measure the water temperature at its very centre, rather than the casing. The use of the bomb calorimeter would enhance accuracy hugely and thus make the results of experimental procedure more comparable to those of theoretical calculation.
ANOMALIES:
Within my experiment, there were several results that can be considered anomalous, as they failed to remain within the + or – 25% accuracy parameters. These results are highlighted for reference in Figure 1. Anomalies are also labelled on my graph in Appendix D for reference.
In reference to Figure 1:
- The two adjacent red highlights for attempt 3 of Methanol and Ethanol, there is a feasible explanation. During the refilling of the calorimeter before these two procedures were performed, the calorimeter slid down the stand, due to an unstable connection. This significantly decreased the distance between wick and calorimeter base. In order to remedy the effects of this anomaly, a fourth repeat was undertaken for all fuels.
- The yellow highlight of Butanol attempt 1 is due to the fact that it was the first experiment and thus the calorimeter-wick distance was improperly calibrated.
- The green highlight for Butanol start mass at attempt 4 was due to a large decrease from the previous end mass, which could have been due to faulty equipment. However, it was accounted for, due to a lid being left off of the spirit burner. Due to the volatility of alcohols, this mass was a realistic loss.
- The blue highlighted figure was anomalous due to the fact that for that single reading, I employed a strategy of double-draught proofing, but then realised this would be unrepeatable, due to the lack of equipment. Therefore, this is the only result to employ such measures.
In reference to Appendix D:
-
Point A The plotting of the Ethanol enthalpy, shows the greatest deviation from the best fit curve. Yet, statistically, ethanol has the second most reliable results for used masses, with only one fairly minor anomaly. This may indicate that the curve is drawn to accommodate the three more deviant fuel enthalpies rather than those that should lie nearer the curve.
-
Similarly point B represents Propanol, which did not have a single used mass figure deviating + or -25% from the average, yet it deviates largely from the best fit curve. This is proof that the curve is in fact incorrectly drawn, as it fails to account for the anomalies of the results table (Figure 1).
-
What can be conceived as a more viable curve (taking into account the anomalies of Figure 1) is drawn on the same axes and labelled Z.
INVESTIGATION:
In reference to the question I was asked to answer, I believe that both my procedures, as well as my research and evaluative methods have proven what I aimed to, and also provided me with information to benefit future similar investigations. I have been able to prove and disprove my various predictions and state with more precision the actual impact of various factors on my final results. Therefore I can evaluate my effort as well-informed and productive in finding a viable conclusion based on statistical and chemical evidence.
BIBLIOGRAPHY
PLAN-
- Chemistry Data Book (B. Earl and L.D.R Wilford);
- AS Chemistry Revision guide (Letts publications);
- Chemical Ideas [pages 57-60] (OCR Salters);
- Physics Revision [page 70] (CGP publications);
CONCLUSION AND ANALYSIS-
- http://www.wpbschoolhouse.btinternet.co.uk/page06/DFalcether.htm
EVALUATION-
- AS Chemistry Revision guide (Letts publications);
- http://www.wpbschoolhouse.btinternet.co.uk/page06/DFalcether.htm