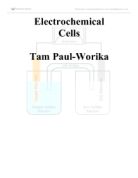
Experiment investigating hydrogen bonding in different chemicals.
Tsuen Wan Public Ho Chuen Yiu Memorial College Form 6 Chemistry Practical Experiment 8: Hydrogen Bonding Date of experiment: 27-1-2011 Objective: A. To discover the existence of hydrogen bonds between ethanol molecules B. To measure the strength of hydrogen bond formed between ethanol molecules C. To investigate the formation of hydrogen bonds between molecules of ethyl ethanoate and trichloromethane D. To measure the strength of hydrogen bonds formed between molecules of ethyl ethanoate and trichloromethane Introduction: A hydrogen bond is the attractive interaction of a hydrogen atom with an electronegative atom, such as nitrogen, oxygen or fluorine, that comes from another molecule or chemical group. The hydrogen must be covalently bonded to another electronegative atom to create the bond. These bonds can occur between molecules, or within different parts of a single molecule. The hydrogen bond (5 to 30 kJ/mol) is stronger than a van der Waals interaction, but weaker than covalent or ionic bonds. This type of bond occurs in both inorganic molecules such as water and organic molecules such as DNA. Intermolecular hydrogen bonding is responsible for the high boiling point of water (100 °C) compared to the other group 16 hydrides that have no hydrogen bonds. Intramolecular hydrogen bonding is partly responsible for the secondary, tertiary, and quaternary structures

Determination of the concentration of limewater solution in g dm-3 as accurately as possible against a standard solution of HCl acid
PLAN The aim of my investigation is to determine the concentration of limewater solution in g dm-3 as accurately as possible against a standard solution of HCl acid. BACKGROUND INFORMATION ABOUT LIMEWATER Limewater solution is a clear coloured saturated Ca(OH)2 produced when calcium carbonate (limestone) is decomposed to form calcium oxide CaO. Water is then added to form CaO (quicklime), to produce slaked lime. Again, excess water is added to form Ca(OH)2 , limewater. Limewater, which is an alkali is used principally in medicine as an antacid as a neutraliser for acidic poisoning or treatment of burns. Limewater as an alkali would have a pH scale of 9-14. I am going to set up my equipment in the form of an acid/base titration since it is a way of measuring quantities of reactants and can be very useful in determining an unknown concentration or following the progress of a reaction which is related to my investigation. The reaction is between an acid (HCl) and alkali, (Ca (OH)2) and therefore it's a neutralisation reaction. In order to determine the concentration of limewater in an experimental way, it is very important to use the most appropriate equipment available. This is why I have chosen to use a pipette, volumetric flask and a burette, as they have an accuracy of +-0.005 cm3, which should produce a suitable accuracy for my experiment. The apparatus I am going to

Mole Ratios in a Chemical Reaction
Renee Buettel Period D4 Ms. Parziale /7/08 Lab #10: Mole Ratios in a Chemical Reaction Paul Bergin Abstract The main objective of this lab experiment was to balance the given chemical equation and to find the correct mole-to-mole ratio of it. The theoretical balanced equation was Pb(NO3)2(aq) + K2Cr2O7(aq) --> PbCr2O7(s) + 2KNO3(aq). In addition, the ratio of moles was one to one.and the correct mole-to-mole ration was one to one. The experimental results matched this ratio. The theory that was proven was that balancing equations give the correct mole ratio of a chemical equation. Introduction In a chemical equation, there are two sides. The chemicals on the tail end are called the reactants and the chemicals on the other side are called products. An example of this given by Coefficients (2008) is 2H2 + O2 --> 2H2O. In this example, "2H2 + 02" is the reactants and "2H2O" is the product. Also, "-->" is the sign for "yield." The big 2s in front of H2 and H2O are called coefficients. In this case, the first 2 indicates that there are 2 molecules of H2, which also means that there are 4 atoms of hydrogen in the reactant part of the equation. The other 2 signifies that there are 2 molecules of H2O as the product. This means that every molecule of H2O that contains 2 atoms of hydrogen contains 4 hydrogen atoms and 2 oxygen atoms. According to Chemistry Formulas (2005), the
Estimated heat distribution by convection in water
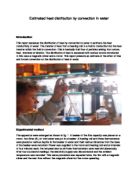
Estimated heat distribution by convection in water Introduction This report assesses the distribution of heat by convection in water to estimate the heat conductivity of water. The transfer of heat from a heating coil to a fluid is conduction but the heat transfer within the fluid is convection. This is basically fluid flow of particles arising from nature, heat, chemical or kinetics. The distribution of heat is assessed with various factors introduced. In this case a magnetic stirrer and a motor. This report presents an estimate of the effect of free and forced convention on the distribution of heat in water. Experimental method The apparatus were arranged as shown in fig. 1. A beaker of five litre capacity was places on a motor, four litres (4L) of cold water was put in a beaker. A heating coil and three thermometers were placed at various depths in the beaker of water and their various distances from the base of the beaker were recorded. Power was supplied to the motor and heating coil and at intervals of four minutes each; the temperatures on all three thermometers were read simultaneously. After four successful readings, the electricity supply was disconnected and the ambient temperature was recorded. This same procedure was repeated twice, the first with a magnetic stirrer and the next time without the magnetic stirrer but the motor operating. Distance from base

An experiment to show the relationship between shape and diffusion rate
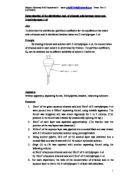
An experiment to show the relationship between shape and diffusion rate Aim To see whether there is a relationship between the surface area and the diffusion rate Hypothesis I predict that the smaller blocks of agar will turn clear, or diffuse first, as it has a smaller surface area. This is because there is less surface area and volume for the sulphuric acid to diffuse into. Apparatus * Three sizes of agar, 20x20x20mm, 20x20x10mm, 20x20x5mm * 240ml of sulphuric acid [80ml per beaker] * 3 100ml beakers * Tile used for placing the agar * Tissue to wipe off the sulphuric acid off the agar * 3 scalpels * Ruler, measurable in mm * Stop clock * Calculator Method . First, cut three pieces of sulphuric acid in the following sizes 20x20x20mm, 20x20x10mm, 20x20x5mm, as accurately as possible 2. Next, fill the three beakers with 80ml of sulphuric acid each 3. Then, prepare the stop clock, and make sure it is has been reset 4. After, place the three blocks of agar into the sulphuric all at the same time, as well as starting the stop clock once the agar is in the sulphuric acid. 5. Carefully stir the three beakers using the scalpels. 6. Watch until one of the blocks have gone completely clear. 7. Once one of the blocks have gone completely clear, stop the stop clock and take out the three blocks of agar and place on the tissue, and wipe off the excess sulphuric

Demonstrate an understanding of the theory, principles and practice of separation of liquid mixtures by distillation techniques
Faculty: Technology Assign/Activity Code: 306/01 Course Title: C&G 0603 - Process Technology Instructions for the use of this cover sheet (1) A cover sheet is required for every activity including presentations (2) Please complete all sections below (3) Staple the cover sheet to your activity Student name: Billy Whelton Unit(s): LEVEL 3 Unit 306: Distillation in the Process Industry Assignment/ Activity title: 01 - Distillation techniques Hand out date: 5-10-2007 Hand in date: 0-12-2007 Graded (Y/N) N Resubmission date for referred work: 7-12-07 Student's comment on activity (if applicable): Student's Signature: ................................................ Date: ................. Assessment Grading Decision (by Assessor). Assessment decision following Verification. Activity designed by Assessed & graded by Key Skills Assessed by Name: Geoff Martin Name: Date: 28-06-05 Date: Internally Moderated by Internally Verified by Name: Name: Date: Date: You must store all marked activities in a portfolio (folder) for External Verification during the academic year. Grading descriptors PASS You have successfully completed all tasks and submitted all evidence as stated. Task Comments Pass Criteria Met Yes/No ALL All areas covered to a good level showing evidence of research and understanding YES Grading Comments Overall
Obtaining pH curves for acid/alkali titrations.
Obtaining pH curves for acid/alkali titrations Obtaining pH curves for acid/alkali titrations Planning In order to obtain a pH curve, I must first devise a way in which to measure both the pH and the volume of alkali being added to the weak acid in order to draw a graph from my results and then from this graph find Ka. Method I will set up the equipment as shown in the diagram below: I will use a pipette and pipette filer to take 25cm3 exactly of the weak acid (0.1M ethanoic acid, CH3COOH) and place it in a beaker. I will then take a burette and place in it 50cm3 of 0.1M sodium hydroxide (NaOH). I will then measure the exact amount of NaOH added to the acid whilst using an accurate pH meter rather than indicator to measure the change in pH. Before using the pH meter, I will first dip it into two buffer solutions of pH 4 and pH 7 and calibrate it so that it reads accurately. I will record the values for the pH and the volume of NaOH added. Theoretically, this should give me a pH curve from which to work. In order to obtain a value for Ka, I shall find the equivalence point (at around 25cm3 where the graph goes up vertically) and find the pH at this point, I shall then divide this by two to give me the 1/2 equivalence point. Having obtained this value, I can assume that: [CH3COOH] = [CH3COO-] = [H3+O] And as: Ka = [CH3COO-] [H3+O] [CH3COOH] Therefore: Ka = [H3+O]
the partition coef of ethanoic acid between water and 2-methylpropan-1-ol
Determination of the distribution coef. of ethanoic acid between water and 2-methylpropan-1-ol Aim To determine the distribution (partition) coefficient for the equilibrium that exists when ethanoic acid is distributed between water and 2-methylpropan-1-ol. Principle By shaking ethanoic acid solution with 2-methylpropan-1-ol, the concentration of ethanoic acid in each solvent is determined by titration. The partition coefficient, Kd, can be obtained due to different solubility of solute in 2 solvents. Apparatus titration apparatus, separating funnel, 10ml pipettes, beakers, measuring cylinders Procedure . 15cm3 of the given aqueous ethanoic acid and 25cm3 of 2-methylpropan-1-ol were poured into a 100cm3 separating funnel, using suitable apparatus. The funnel was stoppered and was shook vigorously for 1 to 2 minutes. (The pressure in the funnel was released by occasionally opening the tap.) 2. 10cm3 of each layer was separated approximately. (The fraction near the junction of the two layers was discarded.) 3. 10.0cm3 of the aqueous layer was pipetted into a conical flask and was titrated with 0.1 M sodium hydroxide solution using phenolphthalein. 4. Using another pipette, 10.0 cm3 of the alcohol layer was delivered into a conical flask and was titrated with 0.1 M sodium hydroxide solution. 5. Steps (1) to (4) was repeated with another separating funnel using the
Quantitative Determination of Food Colouring in Jelly Crystals using UV/Vis spectroscopy
Quantitative Determination of Food Colouring in Jelly Crystals using UV/Vis spectroscopy Aim : To study specific food colouring agents that shows a specific colour . To study the principles of absorbance spectroscopy. To tabulate and analyse data from an Excel spreadsheet. Introduction Food colouring are mainly used in the food processing industry today as colour gives the food product certain flavours as people associate colours with certain flavours. Some is to stimulate a colour that is perceived by the consumer as natural food products. Food colouring also provides an identity to foods, to mask natural variations in colour, decorative or artistic purposes or to protect flavours and vitamins from being damaged by light. Electron transition occurs when valence electrons in a molecule are excited from one energy level to a higher energy level (Silberberg,2008). The energy change associated with this transition provides information about molecular properties such as colour. Ultraviolet-visible spectrophotometry or UV-Vis refers to absorption spectroscopy in the UV visible spectral region. The absorption in the visible range affects the perceived colour of chemicals used in food products involved. In this region of the electromagnetic spectrum, molecules undergo electronic transitions from the ground state to the excited state The Beer-Lambert law states that the
Experiment to obtain curves which show how the pH changes during an acid-base titration and;To use these curves to choose suitable indicators for different combinations of acid and alkali.
Experiment 15 23-3-99 Aim: * To obtain curves which show how the pH changes during an acid-base titration and; * To use these curves to choose suitable indicators for different combinations of acid and alkali. Procedure: . 25.0cm3 of 0.100 M ethanoic acid was pipetted into a 100cm3 beaker, a small stirring paddle was added, and the beaker was stood on a magnetic stirrer. 2. The electrode of a pH meter was carefully clamped so that the bulb is completely immersed in the acid and is clear of the stirring paddle. If a magnetic stirrer (or mechanical stirrer) is not available, it is better to swirl the beaker by hand. If a pH meter is not available, it is better to use a conical flask rather than a beaker. 3. A burette with 0.100M ammonia solution was filled and was clamped over the beaker (or flask) containing the acid. 4. A value of the pH of the acid was obtained, either by reading the pH meter (which must, of course, have been calibrated) or by removing 1 small drop on a thin glass rod and testing with narrow range indicator paper. If which range to use was not known, it is first tested with full range universal indicator paper. However, it is important not to remove more than the minimum acid from the flask. 5. The alkali form the burette were added in steps as shown in result table and the pH at each addition was recorded after thorough mixing. 6. Steps 1~5 were