(Question 2 will be addressed in the Errors section)
Discussion:
Theory
Relationship between heat and solubility
The solubility curve derived from the results of the experiment visually shows the relationship between heat and solubility. From the curve, it can be observed that heat increases solubility. An increase of heat causes the water molecules to move around more so they hit the lattice with greater force, and create more disruption of the lattice. This allows for more of the solid to be dissolved in water, which is an increase in solubility.
Solubility and saturation
Each point on the solubility curve represents the maximum amount of solute that can be dissolved in 100grams of solvent at a certain temperature (also known as solubility). When the maximum amount of solute is added to a solvent, the solution is known to be saturated, as no more solute can be dissolved.
Solute, solvent and solution
The solute is the substance that is being dissolved, and the solvent is the liquid substance that dissolves other substances. Once the solute is dissolved in the solvent, a solution is formed (a mixture of both substances). In this experiment, the potassium nitrate (KNO3) is the solute, and water (H2O) is the solvent.
Polar molecules and Ionic Compounds
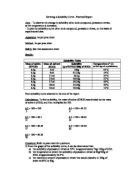
A polar molecule has both positive and negatively charged ends. Water is a polar molecule because it has a difference in electronegativity between atoms, and has an uneven distribution of charges (molecule is asymmetrical):
Due to the difference in electronegativity between atoms, the oxygen atoms are slightly negatively charged because they have greater electronegativity (ability to attract negatively charged electrons), and the hydrogen atoms are slightly positive.
Potassium nitrate (KNO3) is an ionic compound because the potassium (K ) is positively charged, and the nitrate is negatively charged (NO3 ). The electrostatic forces of attraction between the oppositely charged ions hold the ions together (ionic lattice), forming an ionic compound.
Dissociation
Potassium nitrate is able to dissolve in water because H2O is polar and KNO3 is an ionic compound.
When potassium nitrate is placed in water, the slightly positive charge of the H2O molecule is attracted to the negative ion, NO3, and the negative charge of the H2O molecule is attracted to the positive ion, K. As water molecules are in a continuous state of random movement, they pull the potassium cations and nitrate anions of the outer part of the crystal out of the lattice structure and into the surrounding solution.
The water molecules are able to pull the ions away from the lattice because the ion- dipole attraction is strong enough to compete with the ionic bond between the ions in the potassium nitrate lattice and the covalent bonds between the oxygen and hydrogen molecules in water.
When potassium nitrate is fully dissolved in water, the negative and positively charged ions are no longer in their lattice structure, and are separated from one another. This is known as dissociation:
The dissociation of potassium chloride in water can be represented by the equation:
KNO3(s) K (aq) + NO3 (aq)
The nitrate and potassium ions are surrounded by water molecules (ions are hydrated):
Methodology:
To achieve the most accurate measurements as possible, 6.5 grams of potassium nitrate was carefully measured on an electronic balance, and a burette was used to add exactly 5ml to the test tube.
The test tube was immersed in a beaker of boiling water to increase the solubility of the potassium nitrate, so that all of the solute was dissolved. Once the solute was completely dissolved in the solvent, the test tube was removed and cooled. By cooling the test tube, we are slowly reducing the solubility so that crystals of potassium nitrate start to form. (Cooling the solution and observing crystals is an easier and more accurate way of noting the point of saturation. This is because crystals are visible to the eye.)
At the first sign of crystallisation, the temperature was noted, as it was important to keep a record of the temperature at which the solution was saturated for the solubility curve (the very first signs of crystallisation are the point of saturation- where no more solute can be dissolved at that certain temperature).
A further 3mls of water was added to the solution. This is to increase the ratio of solvent to solute (more water to dissolve the potassium nitrate). By changing the ratio, we are able to observe the relationship of temperature to solubility.
It was heated and once again, cooled (with the aid of cold water to speed up the process) until the first sign of crystallisation. These steps were repeated several times, so that a sufficient amount of recordings could be used to draw an accurate solubility curve.
Errors:
The systematic error in this experiment is the possibility of a calibration error on the balance. Random errors in the experiment include: measuring the incorrect amount of water added to the solution, incorrectly reading the thermometer, not noting the temperature at the exact moment crystallisation starts to occur, heating the water to a point where some begins to evaporate (changing the ratio of solute to solvent) and a possible mistake in graphing the solubility curve.
Improvements include: more time needed to gather more data (possibly do the experiment again and find an average to even out extreme results), and a stopper on the test tube would stop the evaporation of water.
Conclusion:
The solubility curve derived from the experiment visually shows that as the temperature of the solvent (H2O) increases, the solubility of the solute (KNO3) increases as well (more potassium nitrate can be dissolved in 100grams of H2O).