Materials:
- Meter sticks (2 per group)
- Coffee filters (6 per group)
- Triple beam balance
- Stop watch
Safety:
- Follow all standard laboratory procedures
Procedure:
Part 1:
- Measure the coffee cup’s mass by weighing it on the triple beam scale.
- Pick out a position for the first coffee cup filter to fall from.
- Place the coffee cup at that time and measure the time it takes for the coffee cup filter to touch the ground.
- Repeat steps 1-3 two more times. (3 trials)
Part 2:
- Place two coffee cup filters together.
- Place the first coffee cup filter from part 1 at the same position you did in part 1.
- Experiment the position it will take for both of the coffee cups to fall in the same time as it took for the first coffee cup filter in part 1.
- When you found the position, record it in your data booklet.
- Repeat steps 3-4 two more times. (3 trials in total)
Part 3:
- Repeat part two but replace two coffee cup filters with three coffee cup filters.
Raw Data Collection Table:
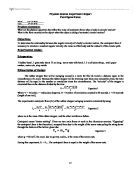
Table 1 Raw data:
Mass of the filter paper is .00109 kg.
Relevant Formulas Used In The Experiment:
Processed Data for the Experiment:
This graph is for MxA:
This graph is for MxB:
This graph is for MxC:
Final Processed Data Table:
Sample Calculations for the Formulas:
*Please look at the diagram below the table:
Conclusion:
The literature value from part 1 for trial 1 and other trials is .8m in 1.13 seconds. The drag force is .0106 Pa·m². When they were two coffee cups, the average time is 1.17 seconds with actual position of 1.29 and the drag force is .0214 Pa·m². The drag force increased by a factor of two because the mass of the coffee filter increased by a factor of two. However, the position did not increase by a factor of two. The estimated position is 1.6m because it is double of .8m. However, the actual position is 1.29m. The velocity did not increase by a factor of two unlike the drag force. Instead it increased by a factor of 1.5. When they were three coffee cups, the average time is 1.10 seconds with position of 1.54m. the drag force is .0320. The drag force tripled to that of the drag force in part one because the mass of the coffee filter increased by a factor of three. However, the position did not increase by a factor of three. The estimated distance is 2.4m but it turned out to be 1.54m. The velocity did not increase by a factor of three unlike the drag force. Instead it increased by a factor of 2.4. The graphs for the three sets of data are not linear. This is a representation that the relationship between drag force is velocity is squared. There’s no percent error because the literature value doesn’t concern the other trials. It’s only a constant that is used to reflect back on. The research question is “how is the drag force (mass * gravity) proportional to the velocity or to the velocity squared?” The hypothesis did not prove it right because it’s not proportional to the velocity. Instead, it’s proportional to the velocity squared because if the drag force is proportional to the velocity then the increase in the drag force by a factor of x with increase the velocity by a factor of x. However this was not the case in the experiment. For example, in part two of the experiment, the velocity increased by a factor of 1.5. As one can see, this is close to the square root of the object’s weight. The object’s weight is square root of 2.18g is 1.47. Indicating it is proportional to the velocity squared. It can be seen in a graphical view by the relationship between the velocity and the drag force. The graph is not linear indicating that the velocity has to be squared because it represents a parabolic equation which is the v^2. The formula itself proves the drag force (D = density * velocity squared * surface area * ½ * drag force coefficient) is dependent on velocity squared.
The procedures are valid because they proved it was proportional to the velocity squared. One of the systematic errors was the ruler. To avoid, this error – one can use a magnifying glass to measure to the millimeter point. The systematic error increased the value by .05m. This is the uncertainty of the results. This is not accurate but precise because the results are similar but they are not accurate because they are off by .05m.
Improvements that can be made in the lab are the use of better equipment such as a computerized system that will measure the velocity at each point instead of when it only hits the ground. The procedures do not have to be manipulated because they proved the theory that air drag is based on velocity squared. The suggestions to improve the systematic error would be to use a magnifying glass to better see the lines on the ruler.