Preliminary results
The formula for sucrose is C6H12O6. Relative molecular mass is (12*6) + (1*12) + (6*16) = 72+12+96= 180mr
1 litre = 1000ml
180g in 1 litre
180/5 in every 200ml
36g in 200ml = 1 mole using this calculation the molarity was worked out.
Percentage change is worked out using the formula:
Weight after – Weight before
Weight before
Variables
These factors must not be changed and are the fixed variables of this experiment.
- The total volume of solution needs to be the same for each sample because if there is more solution in one sample than the other then osmosis will occur faster as the distance between the two regions will decrease so this will not be a fair experiment.
- I will have to leave the samples in the solution for same time because if a sample remains longer then it would have had more time for osmosis to occur.
- Temperature affects the rate of osmosis as at high temperatures molecules have much more kinetic energy than at low temperatures. They move around faster thus osmosis occurs faster.
- Molarity of solution affects the steepness of the concentration gradient. If there are for example, more molecules on one side of a membrane than on the other, then at any one moment more molecules will be moving (randomly) from this side than the other. The greater the molarity difference, the greater the difference in the number of molecules passing in the two directions, and therefore the faster the net rate of osmosis.
- The samples need to be taken from the same vegetable throughout the experiment, as each vegetable has different water potential.
- Size of sample e.g. length and diameter should be the same because it represents the surface area, if the size (or surface area) of a sample is greater then more molecules can cross it at any one moment, and therefore osmosis can occur faster.
So the fixed variables are:
- Volume
- Time left in solution
- Temperature
- Morality
- Same vegetable used
- Surface area
In this investigation, I am going to calculate ψ of the solution inside the cells by working out the molarity of the solution. I am going to achieve this, by working out the point at which there is dynamic equilibrium i.e. no change in mass; which shows that water has not left or entered the sample tissue. This implies, that the ψ of the internal solution is equal to the ψ of the external solution. Plant cells unlike animal cells do not haemolyse they become plasmolysed, I can therefore easily measure the change in mass and length without weight change being a factor because it will be the percentage weight change which will be comapred
To test this I will use 1M sucrose solution. Sucrose is a form of a disaccharide carbohydrate. A mole of a solution can be prepared by dissolving the relative atomic mass of a substance in a litre of water. I am going to prepare sucrose solutions of different molarities by using a technique known as serial dilution and apparatus known as graduated pipette to measure accurately.
In order to make the investigation valid a control experiment is required this should be identical to the test experiment in all aspects but without the independent variable. The control provides a standard with which the test experiment can be compared. This shows that the changes in the test experiment were due to the factor missing from the control experiment. For example, a sample with no sucrose solution will be a suitable control and just water.
In order to get accurate results I will need to ensure a fair test by keeping all the variables constant except the molarity of sucrose solution (independent variable) and use the same procedure and technique throughout. I will also need to make sure that there is no vegetable skin on the samples as it is impermeable.
Prediction
In the control experiment, there will be no sucrose solution and I would expect water to be gained by osmosis to raise the ψp of the tissue increasing the mass and length of the sample. In the experiment with the sample in the most concentrated solution, the mass and length should decrease because the tissue would have become sagging (flaccid). This is because the more concentrated a solution the lower the ψ of the solution, therefore water should leave the cells by osmosis and result in plasmolysis, so that the ψ is zero. I would expect the length to decrease but not by a large amount because I am going to work in small samples, so I think the length should decrease by one or two millimetres. I do not expect the percentage changes in mass to exceed 50 percent either, because I do not think all the cells will become flaccid or turgid but the majority will. The remaining mass may account for other organelles of the cell etc.
Apparatus
After my trial experiment, I have realised that I will have to test more than 4 pieces of potatoes for a fair experiment and measure the length.
- 12 McCartney bottles (with lids)
- 12 cylinders of sweet potato
- Blotting paper or paper towels
- 16 Sticky labels
- Scalpel
- Kitchen knife
- Safety mat or wooden board
- Goggles or safety specs (optional)
- White tile
- Tweezers
- Dowel
-
10 cm Graduated pipettes × 2
-
200 cm Beakers × 2
-
Distilled water ≈ 150 cm
-
Sucrose solution 1M ≈35 cm
- 15 cm ruler
- Top pan balance
- Dowel
- Cork borer (about 10 mm in diameter)
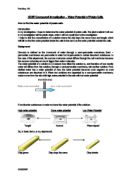
Diagram
Method
Wash each equipment with distilled water first
- Label two bottles each using the labels with: 0, 0.1, 0.2, 0.25, 0.3, 0.4, 0.5 and 0.6.
- For the next step, use a separate pipette for water and sucrose to prevent contamination and to get results that are more accurate.
- By serial dilution, prepare the eight different morality solutions of sucrose and place in with the corresponding labelled bottles.
Table to show how to carry out the serial dilution of 1M sucrose solutions.
E.g. to prepare the 0.6M sucrose solution add 10 cm of distilled water to the correct bottle then using a separate pipette add 15 cm of sucrose solution to the same bottle.
- Take a clean sweet potato and cut in half using a kitchen knife and wooden board.
- Using the cork borer prepare twelve sweet potato cylinders. Cut the cylinders to 3 cm in length as accurately as possible, and make sure that there is no skin, using a scalpel and tile.
- Blot each cylinder (to dry it as much as possible) and weigh each cylinder correct to two decimal places.
- Place one cylinder in each bottle starting with the most concentrated sucrose solution and put the lid on. Make sure you have recorded which cylinder is in each bottle.
- Record the time and leave the experiment for about eighteen hours.
- Using tweezers take out each cylinder and place on paper towel starting with the most concentrated solution.
- Thoroughly blot each cylinder dry, reweigh, and measure the length of each cylinder. Record the results correspondingly to the initial results.
- Calculate percentage change in mass, change in mass per gram, and then the average change in mass per gram to allow effective comparisons. Calculate the average change in length in per mm.
- Plot the average change in mass per gram and the average change per millimetre against the sucrose concentration.
Risk Assessment
- Sucrose dose not carry any risk therefore safety wear is not essential, however it is advisable to wear goggles. Clean any spillages of sucrose solution thoroughly as it can leave sticky patches on surfaces; it is best to place samples and apparatus on paper towels etc.
- Cork borer should be used, by pushing in to the vegetable away from the body on a tile. Also, push out the cylinder at the cutting end of the borer using a dowel.
- Scalpel should be used carefully on a tile away from the body
- Kitchen knife must be used on a safety mat or wooden board carefully and sensibly.
- Pipettes should be used horizontally and pointing away from eyes especially when removing the air, as trapped liquid is likely to squirt out.
Handle all glass wear carefully especially the pipettes
Results
My results
Results from a similar experiment
Analysis
I have chose to analyse both sets of data as both results match closely.
My Results
Results from a similar experiment
To analyse a data I have used the formulas below, because it allows me to make accurate comparisons.
-
% Change in mass = change in mass (g)
Original mass (g)
-
Change in mass per gram = change in mass (g)
Original mass (g)
-
Change in length per mm = change in length (mm)
Original length (mm)
If I plot the change in length against the original length the gradient of the graph would give me the change in length per mm however it is more accurate to just do the calculations manually.
I do not need to calculate the total average in mass per gram because I can just plot the average change in mass per gram and take the mid point of the results.
To calculate the morality of the potato a graph is most appropriate because this can ignore any anomalous results and therefore analysis can be done more accurately to get evidence that is more reliable. I have chose to plot the average change in length per millimetre because by this I can check if the change in length is zero at the same morality, when the change in mass per gram equals zero. If there are two different moralities (from both graphs) then I am just going to use the mid point of both results. This would help make my conclusion stronger.
Conclusion & Interpretation My results show that as the morality increases, the change in mass and length decreases up to a certain point.
At 0 & 0.1 M
There is a large gain in mass and an increase in length. This is because the tissue becomes turgid due to water entering because of osmosis, and ψ difference. This corresponds to my prediction.
I cannot be sure if the cells were fully turgid. A fully turgid cell is assumed to have a ψ of zero from this equation
ψ = ψs + ψp
ψ = 0 ψs = -ψp
At 0.2 & 0.25M
At these moralities, there is a gain in mass and length. This shows that less water was used by the sample to reach equilibrium and there was not a very large difference in water potential (or concentration gradient). This suggests that the morality of the sample is likely to be larger than 0.25M but not by a large amount.
0.3 M & 0.4 M
At these moralities, there is a smaller gain in mass and length. This shows that less water entered the potato tissue. There was also a very small change in length which indicates that the morality of the sample must be bigger than 0.3. There was no change in length at 0.4M, which suggests that the sample gained no water or the change was not significant. However there was a very small gain in mass which implies that water entered the tissue, and the morality of the tissue is going to be near 0.4 but bigger.
0.5 M
There was a small decrease in mass and length so water was lost through osmosis as the concentration of the sucrose solution was too high. However, the small changes indicate that the molarity of the tissue is slightly smaller than 0.5 M. To get an accurate value I need to plot a graph.
0.6 M
There was a large decrease in mass and length as water was lost through osmosis and the cells became flaccid as they plasmolysed. In a plasmolysed cell the protoplast loses contact with the cell wall, it no longer exerts a pressure on the protoplast, so the ψp is zero. This matches my prediction.
The ‘change in mass per gram’ graph shows the molarity of sweet potato at two different points the mid point of these is 0.429 M. The ‘change in length per millimetre’ graph also shows to points of which the mid point is 0.446 M. The average of this is 0.438 M. Converting into ψ it is 1370 KPa.
At this point, the particles are in dynamic equilibrium there is no concentration gradient and therefore is change in mass or length; there may be incipient plasmolysis.
I have found out that if cells lose water by osmosis there is a decrease in mass and length as the cells are plasmolysed and flaccid causing all the sample tissue to become flaccid. The changes in length are not very large as they do not exceed 2.5 mm, the changes in mass are not greater than at 50 % the maximum is 24 % this matches my prediction. I have also found out that ψs and ψp are opposite and plant cells become flaccid or turgid to get the ψ to zero. In dynamic equilibrium, there is no difference in ψ which for this sweet potato is 1370 KPa.
Evaluation
My conclusion not true for all sweet potato because each potato will have a different ψ, due to difference in age etc. Plants cells have different solutes dissolved in their cytoplasm and vacuole. This affects the ψs, which also shows that as different potatoes have different requirements they will have a different ψ. In order to obtain full results for the ψ of potato tissue I should have repeated the experiment with different samples of potato from different potatoes in the same molarity to obtain average results for each molarity.
I have circled the anomalous results from my experiment in red, which have been due to a variety of factors:
- I cannot control changes in temperature, pressure or light for this sophisticated apparatus is required. I also do not know how these may have varied overnight .At high temperatures; molecules and ions have much more kinetic energy than at low temperatures. They move around faster and osmosis occurs faster.
- The cylinders may not have been dried thoroughly enough so the masses may not be correct.
- The solutions may not be prepared as accurately so within each molarity there may have been two different concentrations.
- I should have handled the samples less often as the grease from hands etc. affect the permeability of the tissues.
- Different parts of the vegetable may have different molarities I used the vegetable from different parts I should have investigated this factor.
I did not make sure that I was using sterilised equipment but I think the above would have been my main sources of error. I think most of the evidence is reliable as it corresponds to similar results.
The method I used had many limitations e.g. I could not control changes in temperature, pressure or light, for this sophisticated apparatus is required this would fully assure that these variables are constant. Where I wrote there was no change in length there may have been one but too small to measure. Therefore, I should have used a larger and more accurate scale to measure. I should have also calculated the change in volume by measuring the diameter after and work out the average change in volume.
I could have changed my method e.g. used a dilatometer this has a narrow vertical tube which means that small volume changes produce measurable changes in liquid level e.g. if water entered the tissue then there would have been a decrease in volume of sucrose solution. I could have tested the final solution by looking at the colour intensity to work out most or least sucrose content. Alternatively, a colorimeter can be used to measure subtle differences in colour precisely. This passes a beam of light through a sample of solution in a cuvette a detector measures the deflection produced and presents it in the form of percentage transmission of light (however calibration is necessary). This equipment can be interfaced to a data logger or microcomputer, which enables a graph of concentration against time to be drawn quickly and efficiently by illuminating human error. This ensures accuracy and minimises significant sources of error e.g. little handling of the samples is required.
I should have worked out the rate of diffusion by taking readings at timed intervals. This is more accurate and reliable. If there is a large concentration gradient then the rate of diffusion will be fast.
I will need more readings to do further analysis effectively e.g. histogram. If I did a histogram with the current results, it will probably show nothing significant enough to base a conclusion on.
Even though the points I have considered above do affect my results but do not cause doubts in the evidence and the validity of the overall conclusion.
Bibliography
To complete this investigation (including the plan) I have used the following sources:
- Advanced Sciences Biology 1
- Biology Basic Facts
- A Level Biology
- Internet explorer
- The Hutchinson Encyclopaedia (C.D)
-
Essential Sciences
, but the graph line is quite thick so an exact value cannot be obtained. The ψ of sweet potatoe is therefore between 1350 and 1400 KPa.