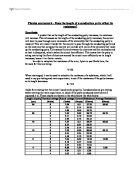
These results prove that the putty that I am investigating is an Ohmic conductor, as even when the potential difference changes, the resistance of the putty remains constant for the same length.
Now that I have proved that the putty does conduct electricity in a constant manner, I can start the main experiment.
Apparatus:
- 1 power pack
- 2 thin copper sheets -these are required in order to improve the efficiency of the volume of current that flows through the putty.
- Emery paper - this will be used to file the copper sheets and so improve their conductivity.
- A mass of putty
- 1 small knife
- A 30cm ruler - in order to accurately measure the length of the putty
- A ceramic tile
- A large piece of scrap paper
- 1 pair of rubber gloves
- 2 crocodile clips
- 4 wires
- 2 digital multi-meters - I chose to use Digital multi-meters over Moving coil meters, as they are less accurate; Digital multi-meters play their readings to an accuracy of 0.01 Volts, plus or minus 0.005 Volts, whilst Moving coil meters display their readings to only 0.1 Volts, plus or minus 0.05 Volts. Another factor that makes Digital multi-meters better than Moving coil meters is that the Digital multi-meter's displays are digital, whilst the Moving coil meters have to be read off the scale by the eye, which is far less accurate. Using the Digital multi-meters makes my results far more accurate and so the data I obtain from this experiment will be more valid.
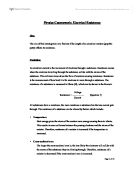
The apparatus that I have described above should be set up as shown below:
Plan:
I will measure the length of the putty from 2cm to 30 cm at 2cm intervals and for each length, I will set the voltage of the power pack to 10V, 8V, 6V and 4V. I will make sure that I record each of the readings for each length of putty 3 times, in order to make my experiment more accurate.
I will set up the above apparatus and put the rubber gloves on my hands. I will then roll out the putty so that it becomes a long cylinder of 30cm. The diameter of the putty in its cylindrical form will be measured and recorded. I will then place the copper sheets at the ends of the putty and clip the crocodile clips onto them. I will then turn the power- pack on to 10V. The readings for current and potential difference will be recorded, so that the resistance can be worked out for that particular readings. This procedure will be repeated for 8V, 6V and 4V for that length. Once 4 readings have been made (one for each different setting on the power-pack), 2cm will be cut off the putty and the copper sheets will be filed using the Emery paper in order to maintain as efficient a connection as possible. The experiment will then be repeated as detailed above for the new length. This will continue until the readings for a putty of length 2cm have been recorded. Once this has been done, the putty will be rolled back into a ball, ensuring that the putty is of the same diameter as it was originally and the whole experiment will be repeated twice more, in order to obtain sufficient readings to calculate average results.
Method:
The method that I actually used in the experiment was the same as my plan.
Fair test:
During the course of my experiment I took some precautions to ensure that my experiment was as fair as possible and that the results that I obtained were as accurate as possible. The list below shows all the controlled variables in my experiment:
- Before I turn on the mains, I will make sure that my hands are completely dry, in order to avoid the risk of electrocution. I will also ensure that there is no water near my workbench, as water carries the current and so I could get electrocuted from any water nearby.
- I will use Digital multi-meters in all of my experiments, in order to ensure that the readings I obtain for both Potential Difference and Current are as accurate as possible.
- For the Digital multi-meter, I will wait until the reading has stopped fluctuating, in order to make the results more accurate.
- Each time we have finished recording results for a particular length, we will wait 30 seconds before continuing the experiment for the new length, in order to allow any heat that has been generated due to friction from the previous experiment to dissipate.
- I will use the same power pack throughout the experiment, as different power-packs may produce slightly different voltages for the same nominal voltage.
- I will wait a few seconds after turning on the power -pack, before making any recordings, as when you first turn on an electrical appliance, it takes a few seconds for the true voltage to flow through the appliance, as when you first turn it on the high resistance and so the reading will be inaccurate if it is taken as soon as the power-pack is turned on.
- I will repeat my experiment 3 times in order to identify any analogous results and to calculate the average resistance for my 3 experiments. I will use this average results to plot graphs and analysis my results, in order for them to be as accurate as possible.
Safety precautions:
Before starting my experiment, I will make sure that my workbench is cleared of all unnecessary material, so that it doesn't get in the way of my investigation. Then, I will check the floor to make sure that there aren't any bags lying around my workbench, as I could trip over them whilst conducting my experiment. Once I am satisfied that the area is safe, I will tuck my stool in under my desk.
The other safety precaution that I will take during this experiment is to constantly make sure that there is no water near any of the apparatus that I am using in the experiment, nor nears the mains supply. I will also make sure that there is no water on my hands for the duration of the experiment, as water conducts electricity and so if I had water on my hands I could be electrocuted.
Finally, before I eat anything, I will make sure that my hands are thoroughly washed with soap and water, in order to get rid of any traces of putty that may have come into contact with my hands during the experiment, as they could be toxic. I will follow this safety precaution even though I am wearing gloves, as small tears could occur in the gloves during the course of the experiment.
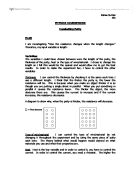
Results:
On the following pages are the results that I obtained from my experiment. The 4th page of tables shows the average results that I obtained and hence used to plot the graphs that I have drawn in Analysis.