I also know that body temperature is normally about 37°c, so around this temperature will probably the best temperature for lipase to work at.
I am going to use a scale of temperatures, which starts at 20°c and reaches up to 60°c; I am using this scale because I know that enzymes are denatured at about 40 – 50°c.
During our investigation I will also bare in mind the Q10 rule, which states that if the temperature is increased by 10°c the rate of reaction is also doubled.
******************************
Constants
- Volume of milk – 3cm
- Volume of phenolphalein – 6 drops
- Volume of dilute sodium carbonate – 5cm
- Volume of lipase – 1cm
- Concentration of bile salts – 3%
********************************
Prediction
I know and predict that the enzymes will digest the milks fat faster in higher temperatures, as the particles in the solution will be moving faster, and therefore have a greater chance of colliding and in turn, working to break down the fats. However I don’t predict that tubes 4 and 5 will have the quickest reaction times, this is because they are at temperatures high enough to denature the enzymes, this will cause them to work slowly or not at all. I know this from a previous experiment, in which we were investigating the effect of bile salts on boiled lipase. In that experiment we found that the boiled lipase had no effect on the fat digestion. This was due to the fact they had been denatured.
I predict that 40°c will be most successful in breaking down the fat in milk and turning the contents in the test tube white. I think this because lipase is a human enzyme, which therefore works best at body temperature, which is 37°c, so I predict 40°c, as it is the closest temperature to body temperature that we are using.
The Q10 rule says that if the temperature is increased by 10, so is the rate of reaction doubled. So, in my results I expect to see a doubling in the rate of reaction, each time the temperature is increased by 10. For example, the rate of reaction at 20 would be 2, and at 30 it would be 3.
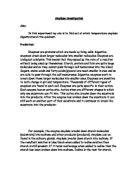
Predicted Graph shape;
*******************************
Apparatus
- Marker pen
- Dropping pipette
- 4 beakers
- Access to boiling water
- 4 test tubes
- Stop clock
- Thermometer
- Test tube rack
- 5cm syringe
******************************
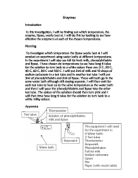
Method
- Label each test tube with a number (1-4) and put them into the test tube rack.
- Using the syringe put 3cm of milk (full ream, 3.6% fat) into each test tube. This is what we call the substrate.
- Rinse the syringe and then add 5cm of dilute sodium carbonate solution to each test tube. This will make the mixture alkaline.
- After rinsing the syringe again add 1cm of 3% bile salts to all of the tubes.
- Next, u must add about 6 drops of phenolphthalein to each test tube (try to give each test tube about the same amount) and shake each one until it has turned completely pink.
-
Fill your 4 beakers with the varying temperatures of water (20°c, 30°, 40°, 50°c and 60°)
- Put one test tube into each beaker.
-
Then add the lipase (it is very important you start the timer now!)
- Lastly you must note the time it takes for each test tube to turn from white to pink.
-
NOTE: the syringe must be rinsed after EVERY usage.
****************************************
Results
This table shows the time taken for each test tube to turn from white to pink at the various temperatures. It also shows the average for each temperature. It shows the averages so I can construct a graph of the averages at a later stage.
Time taken to change pink
*********************************
Now I must make a table showing the rates of reaction, I must do this so I can construct graph showing the rates of reaction for each temperature. I need to be able to do this, as a graph showing the rates of reaction would be ideal to show at which temperature the lipase worked best. To find the rate of reaction I had to divide the number of seconds the lipase took to digest the fats in the test tube by.
***********************************
Conclusion
My results show that at 50°c the lipase was working with the highest rate of reaction. This was not what I expected or predicted as I thought the best working temperature would be 40°c. I didn’t expect the best temperature to be 50°c, as I know enzymes are denatured at about 50/60°c.
The graphs that I drew from my results were almost exactly the shape that I had expected. This is because there was a steady increase in the rate of reaction. Although the graphs were as I expected they were not as the Q10 rule states, as they only doubled every 23- 26°c.
In my experiment I also found that the enzymes were denatured at around 60, this slightly undermines my prediction as I thought that the enzymes would only continue working until 50. I think that this may have been due to mistakes made in our experiments method.
Our experiment showed that the rate of reaction is clearly affected by the temperature that the enzymes are made to work at. However it doesn’t show whether or not human body temperature 37, as I predicted is the optimum temperature for the enzymes to be working at.
***********************************
Evaluation
The results we recorded were not completely reliable because we only recorded the temperature of the water baths and not the actual temperature of the mixture inside the test tubes, meaning that the temperatures that we were measuring were actually wrong, this probably explains why the lipase worked best at 50°c. This meant our results made sense but were in fact invalid. To over come this problem we could have taken the temperature of the actual milk and lipase solution, as this would have given us the temperature that the lipase was actually working at.
Our results were also not completely reliable because the water baths that we were using were not proper water baths; they were ones that we had made ourselves. This means that due to human error heat was lost during the experiment, which would have also affected our results. So if we had the resources and time to complete the experiment again I would use proper water baths so no heat was lost and each test tubes temperature was kept constant. If we had used proper water baths in the experiment we could have done more temperatures than we did as this would have given us more points to plot on your graph so it would have been more accurate and also we would have got a more accurate time at which the lipase works best, if I had been able to do this I would have used temperatures such as, 10°c (which was too lower a temperature to be able to keep it constant without a proper water bath), 25°c, 35°c, 45°c and 55°c.
Another way we could have bettered our experiment would have been to start our timing from the exact moment that the lipases is added, as this is in fact the moment at which the reaction begins to take place, and therefore the moment at which the timing should begin.
Also, to further my investigation I could also consider doing extra experiments in a similar field, using different variables. For example I could vary the PH of the lipase, this would allow me to find the optimum PH for lipase and would tell me whether lipase works best in acidic or alkaline conditions.
I could also consider varying the type of milk that I use in my experiment. I would do this because different milks have different amounts of protein and fat in them, this may then affect our results.