Secondary waves behave differently. This is understandable because the properties of the mare different. They have a maximum intensity at 90 degrees away from the fault. There are two laws that govern the movement of secondary waves.
- Secondary waves will slow down as they pass into rocks of a higher density.
- Secondary waves will speed up as they move into more rigid substances. The waves will stop if they move into a substance that has no rigidity.
The laws of both waves suggest that they do not travel at the same speed as they move through the earth. If the earth were homogenous, then waves ought travel in a straight line. However, as we know that there are differences in density and elasticity, this results in the waves being continually refracted and so therefore their direction is curved.
This diagram reiterates what I have just mentioned. Therefore the direction of the waves is not straight and the higher the density, the greater the refraction.
When an earthquake occurs, seismometer can be used to show the arrival time of both waves, along with the lag time and amplitude. The lag time is the difference in time between the two waves.
This diagram shows a typical seismograph reading. The background noise is the “ambient sound” that is picked up on the detector – e.g. cars driving above the detector can result in a reading. The arrival of the p-wave is clearly seen and once there is a change in pattern type and a slight gap, the arrival of the s-wave can be identified. The amplitude can be calculated by measuring half the wave height. The “lag time” is the amount of time between both waves.
Associated with earthquakes are two different scales but in this investigation, I will be using the Richter scale. This is a logarithmic scale and ranges from 0 to 9.2 (9.2 being the largest ever recorded). There is not a regular increase as you go up the scale. For example, 6.0 is not twice as strong as 3.0. Between 6.0 and 7.0 the wave amplitude is between 10 and 30 times greater different.
In this investigation, I will be using an earthquake simulation program to generate seismic waves and I will explore two variables to see how they alter the waves during an earthquake. I will mention how this will be done in greater detail in the method.
Aims of the investigation
- To see how rigidity affects the waves
- To see how magnitude affects the waves.
Hypothesises
To see how rigidity affects the waves
“An increase in rigidity will lead to primary waves travelling more quickly as they travel through the earth and so therefore there will be a quicker arrival time. Similarly, with secondary waves, as rigidity increases, the arrival time and lag time will decrease. If there is no rigid rock then there will be no secondary waves present. There will be a slight increase in amplitude as rigidity increases. P-waves will still arrive before s-waves”
To see how magnitude affects the waves.
“The greater the magnitude, the greater the amplitude of both waves will be. The arrival time will be the same or very similar as magnitude increases.”
Method
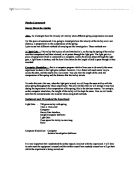
A computer simulation program will be used to generate seismic waves. The detector will be placed on one of the western states on a map of the United States of America and three detector markers will be placed around surrounding areas.
This image is a screen shot from the program that I was using. It clearly shows the epicentre and the three detectors. One way in which a fair test will be ensured is by keeping the detectors and epicentre at the same point throughout the entire experiment.
Detailed method
- Load the computer simulation program located on the college network.
- Choose which map to use – either USA or San Francisco
- Place the epicentre at any desired point
- Place the three detectors accordingly.
- Set the variables to the following
- Incompressibility = 90 GPa
- Rigidity = 90 GPa
-
Density = 3 g/cm3
- Magnitude = 7
- Depth = 30 km
- Investigate magnitude by choosing 5 different magnitude readings, whilst keeping the other variables (above) the same.
- To generate an earthquake once the values have been entered, press the “quake button”
- Print the seismic graphs of after each earthquake generation.
- Investigate rigidity, by choosing 5 different rigidity readings, whilst keeping the other variables the same.
- Likewise, print out the seismic readings.
- Once all of the variables have been tested, take each of the seismic graphs and add the following:
- P-wave arrival time
- S-wave arrival time
- Lag time
- Amplitude
How to plot these variables
P-wave arrival time – When there is evidence of a disturbance in the background seismic pattern, draw a vertical line.
S-wave arrival time- When there is a change in wave pattern, plot a vertical line.
Lag time – The difference between the two wave arrival times
Amplitude – The height of half the wave. Draw a horizontal line that cuts through the wave and measure the height of the wave on one side of the line
- Use the information to draw graphs and relate these findings to the stated hypothesises.
Results
Conclusion for magnitude
My results suggest that the arrival time did not alter drastically when magnitude increased. This is because magnitude does not alter the speed of a wave. However, if magnitude did not affect the arrival time, why were there still minor fluctuations? For example, at magnitude 7, the P-wave arrival time was 126 seconds and at magnitude 9 the arrival time was 122 seconds. This minor alteration could be down to two things: computer error or human error. The computer program used was a simulation program and when the seismic graphs were printed out, it was found that there were occasionally some anomalous lines printed. This would seriously affect the arrival time of the waves. Secondly, when drawing the pencil line on the seismic graph, to identify the arrival time of the waves, the thickness of the pencil itself would take up several seconds, therefore suggesting an inaccuracy. As well as this, it is sometimes difficult to successfully identify the exact arrival time of the waves.
I decided not to include data from magnitude of 1 because it was found that the seismograph generated was too low to identify any traces of waves. In my opinion, the seismic print out at 1 magnitude, at all detectors, show only background noise.
By analysing the table, it is clear to see that if the detectors are placed further away from the epicentre, the longer the arrival time is. This is because the waves have to travel from A-B and so the longer the distance to travel, the more time is required to reach the detector. Additionally it is clear to see that primary waves travel faster than secondary waves. This is because p-waves are longitudinal and so energy travels in a straight line, and so therefore more efficiently, opposed to s-waves, which are transverse, and move in the same way as p-waves but also at 90 degrees to the direction of the wave (less efficiently). This means that s-wave amplitudes are greater than p-waves, because more energy is given out, hence they are more destructive and because they are giving out more energy, the slower they travel.
From the table, it is clear to see that amplitude increases with magnitude. This is because the intensity of the wave is increased, i.e. more energy is supplied to the wave and so the greater the amplitude, the more energy the wave has. Generally, it is clear that s-waves have greater amplitude than p-waves. However, if I just took only the readings at magnitude 3, it would suggest that this would not be the case. However, when I look at the amplitude readings at magnitude 9, it is clear to see that s-waves have much higher wave amplitude.
The reason why the amplitude at magnitude 3 is as it is can be down to a number of reasons. Firstly, it could be down to human error – i.e. I unsuccessfully marked the position of the amplitude or secondly the computer could have printed out an anomalous result. Thirdly, I may have marked out a surface wave rather than an s-wave, and this wave type is not being studied in this investigation. Fourthly, at such a low intensity as magnitude 3, I feel that this is not enough for an s-wave to “operate effectively”. For example, as I mentioned in my introduction, s-waves have a maximum intensity at 90 degrees away from the fault. Although velocity is not an issue here, possibly at low intensities, the wave does not “motion as a typical s-wave” and so has a lower amplitude. Generally though, if we take the extreme, magnitude 9, it is clear to see that s-waves have higher amplitude and so are more destructive.
The closer the wave was to the epicentre, the greater the amplitude was. This seems logical because as distance increases, energy decreases, therefore meaning that amplitudes decrease. My results show that the amplitude is either the highest or the same value at the closest detector.
The lag time, when analysed across all detectors and magnitude, did not fluctuate that much, any big differences were down to human or computer error. If I made a simple mistake calculating one wave, then this would drastically alter the lag time.
Although I partly mentioned, when wave speed did not alter drastically because magnitude was not a factor, there are other issues that need to be addressed. There are always changes in velocities at discontinuities. Due to the fact that the depth was kept at a constant distance, 30 km, then the rock type would not alter and so therefore there would not be a change in velocity. If the waves were entering a discontinuity, then there would be a change in velocity but because the depth is only 30 km (extremely shallow earthquake) this means that there would be no discontinuities. There should have been no dramatic change in velocity, as this was the case.
My graphs show the points I have made well. The first graph shows the p-wave arrival times. There is not much differentiation between each point, which is feasible because magnitude does not affect velocity. The change in line pattern is down to error, be it human or computer. There is one point – magnitude 7 at D2 that is slightly higher than what would have been expected. Again, this is down to error.
In my opinion, the second graph shows a perfect representation of how magnitude affects the waves. It is clear to see that the arrival time is little affected, hence gentle slopes on the graph.
The third graph shows the lag times of the waves. There are two points that I feel are slight discrepancies. I would not class them as being anomalous as such because they are only small differences. These differences are caused by error. It would only take one error on either wave to seriously affect lag time.
The fourth graph clearly shows a positive correlation between amplitude and magnitude. Additionally, it generally shows that the closer the detector, the greater the amplitude. However, there is one discrepancy here, which is at magnitude 7 at D1. This value should be slightly higher.
In conclusion, I have found that an increase magnitude generally led to higher amplitude. If this conclusion is related to my hypothesis:
“The greater the magnitude, the greater the amplitude of both waves will be. The arrival time will be the same or very similar as magnitude increases.”
Then it is correct. An increase in magnitude lead to a higher amplitude but wave speed stayed very similar. Any major differences were down to error.
Conclusion for rigidity
My results suggest that rigidity affected the arrival time of both waves. However, it was interesting to see that no s-waves were produced at 0 rigidity. This is because transverse waves do not travel through non-rigid substances. This is explains why there were no waves present at this rigidity setting. Due to the fact that p-waves have different properties, this explains why they are present at this rigidity. Both waves increased in speed when rigidity increased. One of the laws of s-waves is that they speed up when they pass through more rigid substances. This seems logical because if a substance were more rigid, it would be far easier to transfer energy through the substance, because of reverberation etc rather than a less rigid substance where I feel more energy would be absorbed. If there is less energy absorbed then the wave will not slow down in velocity.
P-waves speed up when they enter more incompressible substances. Rigidity and incompressibility are closely linked. Generally, if a substance were highly rigid, then it would be difficult to compress it; hence it would be highly incompressible. This is explains why p-waves also speed up. However, it was found that s-waves sped up more significantly than p-waves.
The significant difference between the two waves is that energy is given out at 90 degrees from the wave with s-waves, along with the “compression-decompression” motion that are associated with p-waves. This means that when s-waves move though rock, energy is given out, both in the direction of the wave and also 90 degrees to it, hence why they are so destructive. If the rock that the wave is travelling through is rigid, then possibly less energy is absorbed and so therefore the waves are allowed to travel quicker. Possibly s-waves do not travel through liquid not only because the substance is not rigid but also because more wave energy is absorbed by the substance surrounding the wave. I therefore feel that the more rigid the rock is the less energy is absorbs and so therefore the wave is allowed to travel faster. For example, if we take the example of poorly consolidated rocks and bedrock, the poorly consolidated rock is less rigid and so more energy is absorbed, which may mean that the wave travels slower (and more damage down to infrastructure) than through bedrock, where less energy is absorbed because the ground is more rigid and so therefore the wave does not decrease in velocity.
Despite increases in velocity of both waves, p-waves still arrived first. This was because its wave pattern is more “energy efficient”, being longitudinal, and so less energy is absorbed from the surrounding rock, as the energy is travelling in one direction, rather than more than one with s-waves, and so therefore they travel quicker. This explains why both p-waves are quicker to arrive and also less damaging.
Amplitude should not really be affected by changes in rigidity. Magnitude affects amplitude, due to the fact that more energy supplied to the wave results in higher amplitude. Rigidity does not really supply energy to the wave - it only alters wave speed. I feel that amplitude only displays the energy the wave has, nothing more. This explains why my amplitude readings are not entirely conclusive. The main reason for their fluctuation was down to human error or computer error.
Whilst studying my table, I found a few major anomalies that need to be addressed. Firstly, ay rigidity 100 at D1, I found that the s-wave arrival time was 70. However, at rigidity 200 it was 85. After studying the seismic print out at rigidity 100, I have confirmed the arrival time, 70 seconds, to be correct. This means that the arrival time went up slightly when rigidity increased, before falling. As arrival time decreases as rigidity increases, this must therefore be an anomalous result. It is not however a human mistake – I have not just simply wrongly marked the arrival time on the seismic print out, it must therefore be a computer error. When printing my results out, if the printer was accidentally jolted, or it printed a false line on its own accord, this would severely affect my results, as it has done here.
On the other hand, we are only talking a few seconds here and I am using such a small scale so it is easy to get an anomalous result. Similarly, at rigidity 150 at D2 I feel that this reading is slightly too high. However, due to the limitations of my investigation, it is difficult to get a precise reading.
The first graph shows a perfect example of arrival time decreasing as rigidity increased. It is obvious to see that waves are produced at D1 first, being closest to the epicentre. The lines drawn have very similar patterns.
The second graph shows a mixed bag of results. The two anomalies have already been addressed and their reasons explained. Due to the fact that s-waves are more affected by rigidity than p-waves (because the average differences between arrival times are greater for s-waves than p-waves) the line drawn is steeper. The line at D3 shows perfectly how the s-wave changes. There is a sharp increase in velocity with rigidity increase.
The third graph shows that there are anomalies at D1, 2 and 3 at rigidity 150. This anomaly is down to the fact that either the p-wave or s-wave arrival time had been miscalculated or so therefore lag time is affected. Generally though, this graph partly shows that increasing rigidity decreases the lag time. This is what should theoretically happen.
The final graph is rather inconclusive. This is because rigidity does not greatly affect amplitude in my opinion. I feel that amplitude is a measure of energy that a wave has, which explains why there was a correlation between magnitude and amplitude in the other experiment. The graph does show that p-wave amplitude decreases at D1 as rigidity, but again, this could be an anomalous result, due to the fact that the scale of measuring is so small that it is very easy to make a mistake. It also shows that there were no s-waves present at rigidity 0, due to the fact that s-waves cannot travel through un-rigid substances.
In conclusion, I have found that an increase in rigidity did lead to faster arrival time. This seems to suggest that both waves sped up, which complies with the two laws that government the motion of waves. If we relate this to my hypothesis:
“An increase in rigidity will lead to primary waves travelling more quickly as they travel through the earth and so therefore there will be a quicker arrival time. Similarly, with secondary waves, as rigidity increases, the arrival time and lag time will decrease. If there is no rigid rock then there will be no secondary waves present. There will be a slight increase in amplitude as rigidity increases. P-waves will still arrive before s-waves”
Then it is correct. Amplitude was not an important factor in this experiment, as was wave speed in the last one.
Evaluation of this experiment
Although I was able to answer my hypothesises, there were many limitations to this experiment, and much of the method was flawed, in terms of reliability. The scale I was using was so small that it was difficult to plot the arrival time and amplitude on the seismic printouts. This may have resulted in accuracies. In addition, when drawing the p-wave and s-wave arrival times, the thickness of the pencil itself would have accounted for several seconds. Therefore meaning that it was difficult to plot a precise time or amplitude.
When I was calculating the amplitude, it was difficult to measures exactly from half the wave, due to the reasons just mentioned, which therefore resulted in human error. The seismic print out was computer generated, which could have produced inaccurate lines in the seismic printouts, again result in an anomalous result.
However, despite this, this investigation was on the whole rather successful. I was able to collate enough information that could be used to answer what I was investigating. The method was followed exactly as it was stated; I kept the detectors and variables at a constant position, in order to ensure a fair test and consistency. The main flaws in this investigation were down to the analysis of the results. As the depth was constant at 30 km, for both experiments, this made the investigation a lot easier, as there were no major discontinuities.
Therefore I feel that this investigation was not entirely reliable and in order to improve this, several steps need to be undertaken. Firstly, I could increase the scale on the seismic printout so that it is easy to decipher when waves are arriving and the amplitude because the waves will be larger. I could use a thinner pencil or even with the aid of lasers for plotting accurate arrival times and amplitudes. In addition to this, I would find an average of the readings at each detector so that the readings would be more accurate. For example, instead of having 1 detector at each detector, as in this experiment, I would have several detectors at each detector so that an average reading can be worked out.
I have only investigated two factors in this investigation and to further it I could investigate how depth, incompressibility and density affect the arrival time and amplitude of p and s-waves.
.