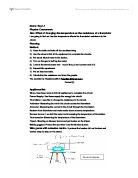
In a series circuit there have power supply, ammeter and thermistor. Because in the series circuit the current is the same at all point in the path, but the current in the parallel circuit divides between the different paths it rejoins where the parallel paths meet .So the ammeter should put in the series circuit.
In the parallel circuit there just have voltmeter. Because the potential difference between two points in a circuit is the difference in electrical potential energy for change moved between those two points. Because potential different is the energy different between two points.
The thermistor is a semi- conductor a mixture of oxides of manganese and nickel. Its resistance varies with temperature. When thermistor is heated, it make electricity more easily. This is because the rise in temperature makes more free electrons available to carry the current. The higher the temperature, the thermistor will less the resistant. So I will use the Bunsen burner to boil the water to increase the thermistor temperature. And the resistance will decrease. I use the voltmeter and ammeter to measuring how many current and the volt in the circuits, and find out the thermistor resistant.
And I will use suitable size measuring the current and volt.
For example: If I use the large size ammeter and voltmeter the mark will move very small I can not easy and exactness to see the current and volt changing.
Prediction:
In experiment I expect the temperature increasing, the resistance will decrease. Because in the circuit have thermistor. It will change the resistance with temperature. If I draw the graph the temperature and resistance will look like the diagram 2
In the graph the low temperature decrease the resistance is more than the hot temperature. Because the thermistor atoms starting activity. There increasing the free atoms and the current will flowing faster and more. In high temperature decrease the resistance much low because the water is boiling (100 C), it could not increasing.
When I do my experiment, I should clear the table and take off the needless thing. Because I use the Bunsen burner, it could burn the book or paper. And than before I used the Bunsen burner must close the air hole, if I did not close the fire will strike back. I put the beaker on the wire gauze with asbestos centre and smooth and steady. If water fall down and the appliance to be wet. The circuits would be short, it is very danger every one.
Before I do the experiment, I try doing one time to see what the current and volt change and make sure the circuit all right and safety. I could see when the temperature is increasing and the voltmeter is decrease and ammeter is increase.
In my experiment I use the ammeter and voltmeter measuring the current and volt. I will use suitable size measuring the current and volt. For example: If I use the too large or small size ammeter and voltmeter the moving range will very small or unclear. It is hard to record the current and volt chancing.
I will repeat this experiment because I want check the data. I will calculate the average of resistance. I would make the graph fair and decrease the error. I put all data in the table; it makes the data clear and easy finds out the error.
My experiment result:
There have list of equation:
I will use this equation find out the resistance
Resistance(R) = Potential different (p.d.)
Current (I)
I use equation find out the average of resistance:
(Resistance1 + Resistance 2)÷2=Average of resistance.
And than I use this equation calculate the gradient
Changing the resistance/ Changing the temperature= the slope gradient
I draw the average resistance graphs to show the result it could clearly show the resistance changing.
Each graph I set two slops to calculate the gradient. If the slope has large gradients it could have large range to decreasing the resistance. Also if the slope has small gradients it could have small range to decreasing.
Slope A is between 35℃ to 55℃ and slope B is between 80℃ to 100℃.
In the first experiment graph:
Slope A:
(1000-570) / (55-35) = 21.5
The gradient is 21.5
Slope B:
(285.7-220.6) / (100 -80) = 4
The gradient is 4
In the second experiment graph:
Slope A:
(997 – 500) / (55 – 35) = 23.5
The gradient is 23.5
Slope B:
(242.4-192.3)/ (55-35) = 4.23
The gradient is 4.23
In the average of resistance
Slope A:
(970.55-535)/ (55-35) = 21.78
The gradient is 21.78
Slope B:
(280-206.45)/ (55-35) =3.68
The gradient is 3.68
In the graph if the gradient is large, there have large current flow in and the low volt, the resistance will high decrease. Also the gradient is small, the resistance will decrease is low.
All the graphs in 35℃ to 55℃ decrease very faster, but the end 80℃to 100℃ is decrease quite slow. This is same with my prediction graph.
Evaluation
In my experiment I should repeat few more times to have more data. This could make the result fair.
In my graphs have some points did not on the best-fit line. I could have some errors in my experiment. It could be read the voltmeter or ammeter not ready correct have some error. I should read quickly. And than the thermometer is not ready measuring the thermistor. Because the thermometer did not close the thermistor. So there have a little error to change the result. So I should use the stand to keep thermometer close the thermistor.