Optinum pH of amylase
The optinum pH of alpha amylase is pH 7.0 [16], therefore I am using a buffer solution of pH 7.0 to control the pH of solution.
Planning
Independent variable
The concentration of copper sulphate at 0.1%, 0.2%, 0.4%, 0.6%, 0.8% and 1.0%.
Dependent variable
The time it takes for the solution to drop of 1.5 arbitrary units of light absorbance.
Justification of independent variable
I have looked at the website, source 14, someone has used the concentration similar to mine to do their experiment, so I believe that these concentration of copper sulphate will be suitable.
Justification of dependent variable
When starch is present in iodine solution, the solution will have a blue-black colour. When amylase is added to the solution, amylase will start breaking down the starch into glucose. As time passes the solution will slowly decolourise as starch are being broken down. Eventually the solution will turn colourless, then to a light green colour. The rate of reaction is therefore linked to the decolouration, the quicker the solution decolourises, the quicker the rate of reaction, therefore I will use a stop clock and colorimeter to measure quantitatively the time it takes for the solution to decolourise for a certain amount, which is showing the rate of reaction. By measuring the time taken to drop 1.5 arbitrary units and not the time taken to drop to a particular value, I am ignoring the starting light absorbance, so no matter what the starting value is, I am measuring the time taken for a fixed amount of starch being broken down.
Justification of number of repeats
I am doing three repeats for each concentration of copper sulphate to increase the reliability of results, this is because any anomaly result can be spotted and discarded. Also I will perform a Spearman’s rank order correlation coefficient test, which is a statistic test after I have got all the results. To perform this test I will need a minimum of 10 pairs of value, with three repeats for each concentration of copper sulphate I have got 21 pairs so this will be sufficient to perform the statistic test. The more the results, the better the statistic test can show the correlation between concentration of copper sulphate and the rate at which amylase works.
How to obtain the data
To get the data, I have to first add the starch, copper sulphate and iodine solution into a test tube and mix thoroughly, a blue-black colour is formed as iodine solution and starch are mixed together. Then I will add the amylase into the solution, and start the stop clock straight away. I will then transfer the solution into a cuvette, and insert the cuvette into the colorimeter to be measured. The blue-black colour will start to turn colourless as the starch starts to be broken down into glucose and maltose. I will measure the time it takes for the solution to drop 1.5 arbitrary units of light absorbance using a colorimeter. To check its reliability I will repeats the results 3 times, and if anomaly is found, I will discard it and repeat the test again.
Control variable
Risk assessment
Equipment list
- 8x 2ml pipette
- 5x test tubes
- Colorimeter
- Stop Clock
- 5x cuvette
- Test tube rack
- 50 ml of copper sulphate of concentrations 0.1%, 0.2% 0.4%, 0.6%, 0.8% and 1.0%
- 200ml of 5% starch solution
- 100ml of 5% amylase solution
- 50ml of iodine solution
- 50ml of buffer solution of pH 7
Justification of equipments
8x 2ml pipette - All solutions that I am using requires a small volume, so a 2ml pipette will be suitable. A small pipette also has a high sensitivity so measurements are as accurate as possible.
5x test tubes - They are needed to contain the mixture of solutions.
Colorimeter - This is to monitor the change in light absorbance of the solution quantitatively, my end point can then be determined.
Stop clock- This is used to measure the time taken for the solution to reach the end point, so the rate of reaction can be compared.
5x cuvette- They are transparent tube that will hold the solution and be fitted into the colorimeter to be measured.
Test tube rack- Test tubes cannot stand by themselves; therefore I need a test tube rack to hold all the test tubes.
50 ml of copper sulphate of concentrations 0.1%, 0.2% 0.4%, 0.6%, 0.8% and 1.0% - This is my independent variable.
200ml of 5% starch solution- Starch solution is needed for the amylase to break it down. It produces the distinct blue-black colour when mix with iodine solution. 5% is used because it is easy for the starch to fully dissolve into the water.
100ml of 5% amylase solution- Amylase is needed to break down the starch into glucose and maltose. 5% is used because it is easy to make and dissolve into the water.
50ml of iodine solution- Iodine solution is mixed with the starch solution to produce the blue-black colour, which enables me to monitor the reaction progress by measuring the light absorbance using a colorimeter.
50ml of buffer solution of pH 7- The pH could change during the reaction and this will affect the efficiency of amylase, therefore a buffer solution is needed to control the pH. pH 7 is used because it is the optimum pH of amylase.
Preliminary method
- Using different pipettes measure out 4ml of amylase, 4ml of starch, and 1ml of 0.1% of copper sulphate solution.
- Add the starch, buffer solution and copper sulphate solution into a test tube.
- Add 2ml of iodine solution into the test tube, mix well by swirling, solution should turn blue black.
- Add the amylase into the test tube and start the clock immediately.
- Mix the solution thoroughly by swirling the solution with a glass rod.
- Stop the clock when a dark-purple colour forms.
- Repeat the concentration 2 times to get three sets of results.
- Repeat steps 1-9 for other concentrations of copper sulphate solution.
Results obtained from preliminary experiment
* Measured with a colorimeter
What did I learn from the preliminary experiment?
By doing the preliminary experiment I can make changes to the apparatus and methods to make up a better experiment that will provide meaningful results. I have found out that it is quite difficult to determine an end point by using bare eyes to over serve the colour change; it is a qualitative measurement which will not give me accurate results. Therefore from test 4 I have decided to make quantitative measurements by using a colorimeter to measure light absorbance, this will give me readings that I can measure and compare with. As I am using a colorimeter now, I have to test the filter of the colorimeter to see which wavelength will give me the best readings, and I have chosen to use the 440nm filter because the readings are small and easy enough to measure. I have to keep altering the volume of each solution to provide a time that is easy to measure and have a sensible time gap between each concentration. I have found out that actually each solution will have a different starting light absorbance; therefore I will measure the time taken for the solution to drop 1.5 arbitrary units. At the end I have found out the best mixture of solutions will be:
-6ml starch solution
-2ml amylase
-4 drops iodine
-1ml copper sulphate
I am also going to add 2ml of buffer solution of pH7 into the solution mixture to make sure the pH of solution is controlled.
Main method
- Using different pipettes measure out 4ml of amylase, 4ml of starch, 2ml of buffer solution and 1ml of 0.1% of copper sulphate solution.
- Add the starch, buffer solution and copper sulphate solution into a test tube.
- Add 2ml of iodine solution into the test tube, mix well by swirling, solution should turn blue black.
- Add the amylase into the test tube and start the clock immediately.
- Mix the solution thoroughly by swirling the solution with a glass rod.
- After 15 seconds from the I start the stop clock, pour the solution into a cuvette.
- Put the cuvette inside a colorimeter, which has a filter wavelength of 440nm.
- Measure the time it takes for the light absorbance to drop 1.5s arbitrary units of light absorbance.
- Repeat the concentration 2 times to get three sets of results.
- Repeat steps 1-9 for other concentrations of copper sulphate.
Result table to show how the concentration of copper sulphate affect the time taken for the solution to reach 1.5 arbitrary units of light absorbance
The following table shows the temperature of the solution when the solution is being carried out
Standard deviation
This table sums up the standard deviation for each concentration of copper sulphate. The error bars are plotted on the graph as error bars to show the standard deviation.
Conclusion from graph
There is a general trend from the graph that as the concentration of copper sulphate increases, the time taken for the solution to drop 1.5 arbitrary units’ also increases, in other words the rate at which amylase works decreases when concentration of copper sulphate increases. However the rate of increase decreases as concentration of copper sulphate increases. There is an anomaly result at concentration 0.8%, which I have circled and ignored when plotting the line of best fit. The two lines that project out on either ends of the points are the error bars, they are very small because indeed the standard deviation is very small.
Statistic test- Spearman’s rank order correlation coefficient test
I am going to perform a statistic test to compare the relationship between the two variables, which are the concentration of copper sulphate (independent variable) and the time taken for the solution to reach 1.5 arbitrary unit of light absorbance (dependent variable), or the rate of reaction in other word. I will find out whether there is a correlation between the two variables or not mathematically. I will use the Spearman’s rank order correlation coefficient test; this test enables me to find the strength of the correlation between two variables and can be used with small data sets [6]. There are five steps to work through to complete the test. Firstly, a null hypothesis is needed, which basically said that there is no correlation between the two variables.
1. Null Hypothesis
There change in concentration of copper sulphate has no effect on the rate at which amylase works.
2. Calculating the Spearman Rank Correlation Coefficient
After plotting the table above I have to use the equation below to calculate the Spearman Rank Correlation Coefficient (rs).
rs=1- 6∑D 2
n(n2-1)
[4]
Firstly, I have to calculate the value of 6∑D 2, which is the sum of all difference squared and multiplied by 6.
∑D 2 = 1+1+0+1+0+1+1+0+1+1+1+0+1+1+0+9+16+4+4+16+9
= 68
6∑D 2 = 6 x 68
= 408
Now I have to calculate n(n2-1), n is the number of pairs of measurements.
n= 21
n(n2-1) = 21 x (441-1)
= 9240
With these two values I can now calculate the Spearman Rank Correlation Coefficient (rs).
rs=1- 6∑D 2
n(n2-1)
rs = 1- 408
9240
rs = 0.956 (3sf)
The Spearman Rank Correlation Coefficient is 0.956.
3. Determine the critical value, to 5% level of significance
4. Conclusion
This table shows the critical value for the corresponding number of pairs, and is to 5% level of significant. I have 21 pairs of results, so I will look between n = 20 and n = 22, and the critical value is between 0.450 and 0.428. The Spearman Rank Correlation Coefficient that I have calculated is 0.956, which is bigger than both 0.450 and 0.428, therefore I can conclude that the null hypothesis is rejected, both graphically and statistically, or mathematically. In other words there is a correlation between the two variables. The Spearman Rank Correlation Coefficient has a positive sign, indicating that there is a positive correlation between the two variables, so I can conclude that as the concentration of copper sulphate increases, the time taken for the solution to drop1.5 abitrary units of % transmission increases as well. This shows that copper sulphate is an inhibitor of the enzyme amylase and rate of reaction will decrease if copper sulphate concentration increases.
Biological conclusion
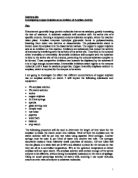
The time taken for the solution to drop 1.5 arbitrary units of light absorbance is 177 seconds in average without any copper sulphate added to it. As concentration increases from 0.1% to 1.0% of copper sulphate, the time taken increases from 450 seconds to 926 seconds. This means the rate of reaction is decreasing when the concentration of copper sulphate increases. There is an anomaly result when concentration is 0.8% as it rises to 1406 seconds. The gradient of line is decreasing when concentration increase showing that the rate of increasing of time taken is decreasing. Copper sulphate is an irreversible non-competitive inhibitor of the enzyme amylase [14]. Copper ions have not got a complementary shape that can fit into the active site of amylase; therefore it is non-competitive as they do not compete with the substrate for the active site. Amylase is made up of numerous of amino acids, and cysteine, a particular type of amino acid, is where the inhibition take place. Cysteine has the formula C3H7O2NS, with the structure shown below.
[18]
The S-H group is called the sulphydryl group. This group can be located in the active site or elsewhere. Copper ions will combine permanently to the sulphydryl (-SH) groups. This could be in the active site or elsewhere [13] of the enzyme. This replacement changes the structure of the amino acid as well as the active site of the enzyme permanently; therefore the starch can no longer bind to the active site of amylase and cannot be catalysed. The rate that starch is being broken down will therefore decreases as there are less active sites available for them to bind to. The reason that the rate at which amylase works decreases when concentration of copper sulphate increases can be explained by the collision theory. A reaction only happens when particles collide with each other right way around, and they have to collide with enough energy for bonds to break[21]. When concentration of copper sulphate increases, there will be more copper ions present in solution, there will therefore be more collision between the copper ions and S-H group, resulting in more successful collisions and inhibition of amylase. Also the fact that there are more copper ions present means that there will be more S-H group being changed in S-Cu group, therefore more amylase will be inhibited. With the two reasons above the time taken for the solution to turn blue black will increase when concentration of copper sulphate increases.
Reliability of results
The error bars are very small that no two bars overlap each other; this increases the reliability of my results. To further improve the reliability of my results, I have repeated the results three times. The reliability will bee even better if more repeats are done, for example 7 sets of results for each concentration of copper sulphate, however that will be too time consuming. I have done everything mentioned in the section about control variable to make sure it is a fair test. But the reliability drops as there is an anomaly result when the concentration of copper sulphate is 0.8%, which means there is something wrong when I am doing the experiment. Also I cannot improve the reliability of results by comparing with others because there is no others that have performed the exact same experiment as mine.
Validity of results
The results are valid because I am measuring the right thing. In this experiment I am trying to find out how the concentration of copper sulphate affects the rate at which amylase works, so I need to measure and compare the rate of reaction. I have measured the time taken for a fixed amount of starch (reactants) to turn into maltose and glucose (products). The time taken is easy to measure; I simply used a stop clock to do it. To measure a fixed amount of starch that is broken down into maltose and glucose, I am going to use iodine solution. When iodine and starch are present in solution together, the solution will turn blue-black. The colour will turn lighter when there is less starch present, so by using a colorimeter to measure the light absorbance, the reading will gradually drop as the starch is being broken down by the amylase. I have measured the time taken for the solution to drop 1.5 arbitrary units of light absorbance, by measuring the drop of 1.5 arbitrary units; I am effectively measuring a fixed amount of starch that is being broken down.
Evaluation
The anomaly result- There is an anomaly result when the concentration of copper sulphate is 0.8%. This anomaly is obviously a systematic error as the time for the three repeats are within a small range. Temperature of solution could affect the rate of reaction, but the average temperature is 22.3°C, which is not a big difference to the others set of results, so it is not temperature. The concentration of amylase and starch solution should not be the cause because I have done 1.0% of copper sulphate after 0.8% and 1.0% follows the trend, also I am doing the whole experiment within 4 hours and have kept the lid on to the amylase and starch solution for as long as possible, so there should only be very little evaporation to affect the concentration. Volume of each solution is measured carefully every time, so should not be the cause as well. A possible reason is that when I am using the cuvette I did not use the same sides for each measurements, and cuvette is designed that only the two correct sides can give the correct reading, and if I used the wrong sides the reading will be affected. However this will be a randam error and all my results are fairly constant which shows that it is unlikely that this is the case. The most likely reason of this anomaly result is that the copper sulphate is not actually 0.8%, maybe because when it is first prepared more copper sulphate is added then required, so it has a higher concentration and a bigger inhibiting effect as concentration then the graph suggested. If there is time I should remake the copper sulphate and use that to complete the experiment.
I am going to assess the limitations to results,, with the top being the most influential.
Concentration of copper sulphate- The concentration I am using is very low that even a very small change of water content will effect the concentration and the results; therefore I have to avoid as little evaporation as possible by keeping the lid on the bottles of cooper sulphate when they are not being used.
Cuvette- Cuvette is a rectangular transparent tube that can be fitted into the colorimeter and the light absorbance of the solution is measured. It is therefore important to keep the cuvette as transparent as possible. Our hands have oil and when we hold the cuvette, the oil will stick to the cuvette, which could affect the light absorbance. It is therefore important to always hold onto the 2 sides of the cuvette that is not having the light being shone through; therefore the result is not affected by the oil. I have to always measure the two sides that are fully transparent when measuring the light absorbance, otherwise random error will be introduced and affecting my results. The limitations by the cuvette is ranked the second most influential because the colorimeter is very sensitive, and therefore a small change can affect the results quite significantly.
Colorimeter and temperature- When I press the button to measure the light absorbance, a light will be shone through the solution, therefore there must be heat generated and transferred to the solution. To avoid this problem, I have to press the measure button for the least possible times. The best way to do it is to do a preliminary test for all concentration, so I will roughly know the time it takes for the solution to drop 1.5 arbitrary units. Then I will only start pressing the measure button when the time gets close to the end point, so this will minimize the effect on the temperature of solution.
Temperature of solutions- It is difficult to control the temperature of the solution throughout the whole experiment because I cannot put the cuvette into the water bath as I have to insert it into the colorimeter to be measured. The best way to keep the temperature constant is to put all the solutions into a water bath that is set at a constant temperature, then do the mixing and measuring in the shortest time possible, this way their starting temperature will be the same so the temperature difference will be minimized.
References
[1]
Information on water and waste pipes Last updated on December 2004
[2]
How copper sulphate treat tree roots
[3] Information of copper sulphate
[4] -
Last update on January 07, 2010. Safety data for copper sulphate.
[5] http://cartwright.chem.ox.ac.uk/hsci/chemicals/iodine.html
Last update on January 15, 2004. Safety data for iodine.
[6] A2 statistic help sheets SEH/June 2004
[7] Biological Science 1 & 2 Third Edition Author: D.J. Taylor, N.P.O. Green, G.W. Stout Editor: R. Soper
Published in 1997, by the PRESS SYNDICATE OF THE UNIVERSITY OF CAMBRIDGE
[71] Chapter 4, Enzymes, page 116
[72] Chapter 4.1.2, Lock and key theory, page 117
[73] Chapter 4.1.2, Techniques to prove the ‘induced fit’ hypothesis, page 118
[74] Chapter 4.1.2, Theory of ‘Induced fit’ hypothesis, page 118
[75] Chapter 4.4.1 Competitive inhibition, page 123
[76] Chapter 4.4.2 Non-competitive reversible inhibition, page 124
[77] Chapter 4.4.3 Non-competitive irreversible inhabitation, page 124-125
[8]
The tertiary structure of an amylase molecule
[9]
A diagram showing how enzyme works
[10]
A diagram to show the induced fit theory Last update at 2008
[11]
A diagram showing competitive inhibition
[12]
Information on the different type of inhibitions Published by Elmhurst College, Charles E Ophardt. Last updated at 2003
[13]
Information on how copper sulphate inhibits amylase
Last update October 2009 Published by Jim Clark 2007
[14]
Last update 2010
[15]
Information on the iodine- test for starch Last updated at 2009
[16] The Effect of Temperature, pH, and Salt on Amylase
in Heliodiaptomus viduus (Gurney) (Crustacea: Copepoda: Calanoida)
TAPAN KR. DUTTA, MALABENDU JANA, PIRITI R. PAHARI, TANMAY BHATTACHARYA
Turk. Journal. Zoology., Volume 30, (2006), 187-195.
[17]
Application of copper sulphate
Copper Development Application Inc. Last updated at 2010
[18]
A diagram of cysteine
[19] Cleapss 2000 Safety data of chemicals
[20]
Last updated in 2008 The function of amylase
[21]
Information for the collision theory Last updated in 2002
Credibility of references
I will rank the references in three levels; level 1 being the most credible and useful , and level 3 being the least credible and useful.
Level 1
Source 1: This is a website produced by the Royal Institute of Technology, which is a University responsible for one-third of Sweden capacity for engineering studies and technical research at post-secondary level. The information therefore will be very credible and professional. The information is very useful as it explains clearly how copper sulphate can exist in the drinking system.
Source 3: This is a website produced by four different universities in the US so it is very credible. They have themselves used a lot of journals and books as their references to produce the information which adds to the credibility. The information are very useful as they are detailed and relevant.
Source 4: This website is produced by the Safety Officer in Physical Chemistry at Oxford University. Oxford is a world renowned university and therefore the information will be very credible. I compared this source with source 18 which also talks about the safety data of different chemicals, and both show similarities so reliability increases.
Source 5: Again this is a website from Oxford University which is going to have high credibility. I compared this source with source 18 which also talks about the safety data of different chemicals, and both show similarities so reliability increases.
Source 6: This source is very credible because it is produced by Bromsgrove School to help A2 students to do their statistic tests. It is published in 2004 and no modification has been made since, which means students from previous years would have done their statistic tests correctly with the help of this information. It is very useful as well because it guides me step by step on how to complete the statistic tests.
Source 7: This is a book written by doctors and professors and is published by the Univeristy of Cambridge, which is a renowned university so this will be a very credible source. This is a very useful source as well because it has a lot of details on the inhibition of enzyme which I can use to explain ideas in my research.
Source 10: This website is designed to help GCSE and A-level students to understand science so the information will be credible. The diagram that I have used is very useful to illustrate the ‘induced fit theory’ and there are captions to explain the progress, therefore this source is both credible and useful.
Source 12: This website is published by the Elmhurst College, Charles E Ophardt, so the information should be credible. It explains how different types of inhibitions works with good diagrams so the information is very useful.
Source 13: There is only one author on this website and he is Jim Clark, who has graduated from Cambridge and has a teaching experience of over 30 years. He is the author of many textbooks including the and , the information in this website will therefore be very credible. Although not very detailed, the information is very useful as it enables me to know where and how copper sulpahte actually inhibits amylase, there is also a diagram that is illustrates well on how copper sulphate inhibits amylase.
Source 19: CLEAPSS is an advisory service providing support in science and technology for a consortium of local authorities and their schools including establishments for pupils with special needs, therefore the information will be credible. The safety data are very useful to complete the risk assessment.
Source 20: This website is very credible because it is published by a company which works on enzyme, so their information on amylase is very useful and professional.
Source 21: There is only one author on this website and he is Jim Clark, who has graduated from Cambridge and has a teaching experience of over 30 years. He is the author of many textbooks including the and , the information on this website will therefore be very credible. Although not very detailed, the information is very useful as it explains how the collision theory works.
Level 2
Source 2: The information on this website is only written by one person; however the writer is quite highly qualified so the information will still be credible. Also the article is published in a website that is designed to help solving cosmetics problems, so it will be checked and edited. The information in there is quite useful as well as it suggests another possible way that copper sulphate can get into our drinking system.
Source 8: This website is produced by the Medical Research Council in Cambridge, so will be very credible, however the diagram itself is very useful as it does not shows where the active site is.
Source 9: It does not look like a credible source just stands by itself because it is not published by a renowned University or company, it is a website talking about a fish called yellow tang. However the diagram that illustrates how enzyme work is very useful and clear, the credibility actually increases as I compare this with other diagrams and they show similar things.
Source 11: This source is credible because it is published by the University of Miami. However the diagrams I have used is detailed; the diagram is not annotated but gives a good visual idea of how inhibitor blocks the active site so substrate can not bind to it.
Source 16: This is a professional scientific journal therefore information will be very credible. However the information is not quite relevant to the experiment I am doing. But it does talk about the effect of copper sulphate on amylase which is a useful piece of information that I can use.
Source 17: This is a website published by the Copper Development Association Inc. which talks about the applications of copper. The information will therefore be very professional and credible as they are a company working with copper, but the information is not useful because it is not quite relevant to my coursework.
Source 18: It is a diagram of the enzyme cysteine, and this is the correct structure as I have compared with source 12.
Level 3
Source 14: This is a website that students will post their questions other people will answer them if they think they have the answer. There are many A-level students in there asking questions about the experiment of copper sulphate and amylase, and mostly they are other the A-level students who answer the questions, so this source is not credible. However this website gives me a general idea on how to plan my coursework such as to decide on the concentration of copper sulphate that is suitable to use. The information is actually very relevant to the planning of my experiment because they have done the coursework themselves, so I can learn from their experiments and come up with a good planning of my own experiment.
Source 15: This is a source from the wikipedia and the information on there are usually nor credible.