Plan
Apparatus
Five test tubes
Labels
Ruler
Scales
Tissue paper
1mol sucrose solution
Distilled water
Measuring cylinder
Potatoes
Potato borer
Knife
Test tube rack
Chopping board
Variables
I am going to be measuring the length and mass of the potato chips before and after they are soaked in solutions. I will measure their length with a ruler in mm and their mass on the scales in g. I will have two potato chips in each test tube so that I can take an average of the two masses and lengths at each concentration to make it more accurate. The independent variable will be the concentration of the sucrose solution. I will do the experiment at five different levels of concentration; 1mol, 0.75 mol 0.5 mol, 0.25 mol, 0 mol.
Each of the solutions will be 20ml. 1mol = 20ml sucrose
0.75mol = 15ml sucrose and 5ml distilled water
0.5mol = 10ml sucrose and 10ml distilled water
0.25mol = 5ml sucrose and 15ml distilled water
0mol = 20ml distilled water
I will make sure that all the potato chips are the same length and width by cutting them with the same borer and measuring their lengths and cutting them to all be equal. I will not leave and potato peel on the ends of any of them as this may not let water through as easily. I will put them all in the test tubes at the same time and get them out at the same time so as they all have the same length of time in the solution. I will keep them all inn the same place so they all have the same temperature and light. Once I have got them out I will gently pat them dry, as I do not want to include the liquid on them as their mass. I will measure each of their lengths and record it accurately. I will find the average of the two lengths and masses at each concentration.
I am taking five different concentrations from 0mol up to 1mol I am doing this so as I can get a good shape in my graph. It should have both increases and decreases in mass in this range of concentrations.
Safety
To make it safe I will tie my hair back, tuck chairs in, keep bags under desks, be careful when using the knife and borer, clean up if any of the solution is spilt. Keep the tubes in a safe place where they are not going to get knocked over.
Method
I will collect all the equipment I need
Put the potato in the board and cut out five cylinders from it using the potato borer. Make sure that they are all full cylinders
Then cut the peel from both ends of each chip.
Measure one of them, record it, and cut the others to be exactly the same length.
Then label your five test tubes with the molarity of solution you are going to put in it. Put them in the test tube rack.
Then weigh the chips one at a time and record its mass and which solution it will go in so that you will be able to compare the mass before and after. Once they are weighed put them in the correctly labelled test tubes. Then measure out the sucrose for each of the tubes accurately and put it in then measure out the distilled water and put that in.
Leave them in a safe place overnight and return to them the following day.
Pour away the solution from each test tube and dab dry the chip with a paper tissue. Weigh each of the chips and record the results. Do the same for all the test tubes.
I did one trial run before I did it for real. I did not measure the length of the chips but then I decided it would be interesting to see what the effect was on the length. I did not have any big problems in the trial run.
My results were as follows:
From this I can see that my prediction was correct but I would like to measure the length as well in the real experiment. I found that the concentration of the potato must be between 0.5 and 0.25 as that is where the graph would have crossed 0.
Results
Table showing mass.
Table showing length.
Conclusion
From my graph I can see that my prediction was correct. The stronger the sucrose concentration the more mass is lost from the potato.
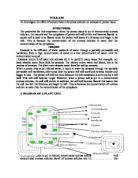
Osmosis is the movement of a solvent through a selectively permeable membrane (as of a living cell) into a solution of higher solute concentration that tends to equalize the concentrations of solute on the two sides of the membrane. In my experiment this is what happened. The water from the side with a lower concentration moved through the selectively permeable membrane onto the side with a higher concentration.
Selectively permeable membranes are very thin layers of material (cell membranes are selectively permeable), which allow some molecules to pass through them but prevent other molecules from passing through.
Cell membranes will allow small molecules like Oxygen, water, Carbon Dioxide, Ammonia, Glucose, amino-acids, etc. to pass through. Cell membranes will not allow larger molecules like Sucrose, Starch, protein, etc. to pass through.
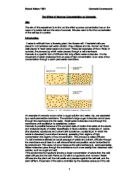
When the sucrose concentration was higher in the solution than in the potato chip the water from the chip moved through the selectively permeable membrane into the solution. This meant that on the graph when the concentration was highest the mass of the potato chip had decreased most. When I had the chip in distilled water this is what happened;
The water concentration was higher in the solution and so some of it moved through the selectively permeable wall into the potato chip where the water concentration was lower.
I think that I took enough results to have a clear graph but if I had had more results I may have had a more accurate line of best fit.
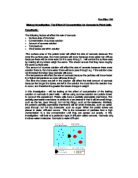
I also made some visual observations. When the chip was in a high sucrose concentration and water had left the potato it was soft and not turgid. When it was in a low sucrose concentration solution it was turgid and hard this is because the cells were full of water and therefore they were hard and did not decrease in size. When they had lost water the cells weren’t full of water and so they were not as turgid and hard and so they decreased in size.
My result at 0.25 mol sucrose concentration was only 0.32% increase in the mass of the potato chip. This means that it was very close the cell sap equivalent. I found that when the potato increased in mass it did not increase in length but instead it stayed the same length. When The potato lost mass it also decreased in length. The graph looked to be forming a straight line which means that the increase in sucrose concentration is directly proportional to the change in mass and length. The formula for the percentage change in mass of the potato is the molarity of the sucrose solution x 40 + 6. This is because the line goes down by 10% for each 0.25 change in molarity, and the line crosses zero at 6% increase.
Evaluation
I think that the experiment could have been improved to give me more accurate results. If I were to do it again I would have more results to take an average of at each level of concentration by having more chips in each test tube. This would make it more accurate as when I had two in a test tube if one of them was a long way out it made the graph not follow the line well when I plotted the averages.
There was one anomalous result at 0.5 mol. I think this was because we patted them dry when we got them out of the test tubes as we did not want to weigh there water on the outside of the potato but I think that we may not have dried them all equally so this anomalous result may have been due to it having water left on the outside of it.
Also the potato itself was not from the same part of the potato and was not exactly the same size, although I did try to cut them to 36mm each.
I could also try the same experiment but with different volumes of cell tissues and see if the percentage change differed with a bigger and smaller surface area.
I could now investigate the smaller range near to 0.25 to see the sucrose concentration equivalent to the potato.
Finally, I could extend the experiment to a more exact level by looking at the potato cylinders under a microscope, then I would be able to see the cells in greater detail and draw some more observational results.