Procedure
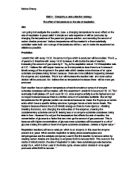
Figure 1. A Diagram showing the sealed test tube containing a glucose and yeast solution maintained at 40˚C producing carbon dioxide gas bubbles and delivering them into a second test tube containing lime water.
Two test tubes were obtained and one was half filled with limewater, the
other was half filled with a glucose solution and a sample of live yeast. The test tube containing the yeast and glucose solution was then placed into an ice filled beaker until it had cooled down to a temperature of zero degrees Celsius. Next, a delivery tube was fitted through a rubber bung and placed into the yeast and glucose test tube, above the solution, to create an airtight seal. The other end of the delivery tube was positioned in to the other test tube containing the limewater, and the resulting bubbles were counted. The experiment was repeated a further four more times using yeast and glucose solutions at 22(RT), 40, 60, and 90 degrees Celsius. To ensure a fair test all temperatures were acquired using a thermometer, and the numbers of bubbles given off by the yeast were recorded over a ten-minuet period. For the precise methods used please visit appendix 6.
Results
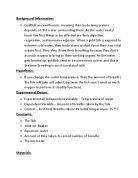
Table 1. A table displaying the number of bubbles produced by each of the test tubes containing the same glucose and yeast solution differently maintained at a range of temperatures over a period of ten minuets.
The results indicate that no carbon dioxide gas bubbles were observed when the glucose and yeast mixture was suspended at temperatures of 0˚C and 90˚C. The highest number of bubbles, 75 in total, over a ten minuet period were seen to be produced by the yeast and glucose sample that had been regulated at 40˚C. When the yeast solution was maintained at 22˚C it was observed that 5 bubbles of carbon dioxide gas were evolved into the limewater. At a temperature of 60˚C the yeast mixture managed to produce 25 bubbles in the ten-minuet period.
A graph of the results from the experiment was constructed and a copy has been included on the following page
Conclusion
The main aim of the experiment was to perform a simple test at a variety of temperatures in order to observe any changes in the yeast sample respiration rate. The temperature of the test solution that evolved the highest number of bubbles was to be considered the optimum temperature for respiration to occur in Saccharomyces Cerevisiae, brewer's yeast. As I only wished to investigate the influence of temperature on the fermentation rate other variables such as the type and amount of glucose solution used, age of the yeast culture, and size of the yeast culture had to be controlled. Maintaining a constant temperature, for example 0˚C, for the ten-minuet test period was not easy as the fermentation process actually produced additional heat. The bubbles of gas produced during the experiment were confirmed to be composed of carbon dioxide as the limewater situated inside the collection test tube turned cloudy white in colour. The temperatures investigated during the experiment were 0˚C, 22˚C, 40˚C, 60˚C and 90˚C. Results from the study showed that no carbon dioxide bubbles were produced at all when the yeast and glucose solutions were held at temperatures of 0˚C and 90˚C, indicating no respiratory activity. Most carbon dioxide bubbles, 75 in total, were produced by the yeast mixture maintained at 40˚C, showing the highest level of respiratory activity. As the yeast respired anaerobically during the study they used a series of chemical processes and enzymes to assist with the brake down of the glucose molecules. The energy contained in the bonds of the simple sugar molecules was then used to form other high-energy storage units known as ATP, adenosine triphosphate. The enzymes within the yeast required for the processes of respiration, or fermentation, seem to have been influenced by the changes of temperature. An enzyme is a chain of amino acids that are all held together in a helix structure by a variety of R group attractions, peptide bonds and hydrogen bonds. At certain locations along the chain there are specifically shaped active sites, which attract specifically shaped substrates. When the active site joins with its unique substrate the enzyme may perform a reaction, such as catalysing respiration in a yeast cell. Active sites are sensitive to temperature; a significant heat rise would cause the bonds holding the three-dimensional structure to brake, therefore altering the overall shape. At this point the changed active site would no longer be able to accommodate its unique substrate and the enzyme would cease to function and become denatured. If the enzymes could not function processes, such as respiration that require them, could not occur. The results from the experiment support this theory as the rate of respiration within the yeast samples declined as the temperature rose above 40˚C. It is assumed that too many enzymes had become denatured above 40˚C to allow the yeast to continue to anaerobically respire. When temperatures fall too far below the optimum allowance, enzymes also struggle to function as the amount of activation energy required to initiate reactions is too great. At cooler temperatures molecules circulate much more slowly leading to a reduced rate in collisions between the active sites and the substrates, producing overall fewer enzymatic reactions. The evidence obtained from the yeast study supports this theory as no bubbles of carbon dioxide were observed at 0˚C, suggesting a reduction in respiration due to a fall in enzyme activity. In conclusion the results from the experiment have shown that the optimum temperature required for successful respiration in Saccharomyces Cerevisiae, brewer's yeast, is approximately 40˚C. If temperatures deviate much from this optimum point on the thermometer, it may be assumed that fewer essential enzymatic reactions will occur and that the overall rate of respiration will reduce.
References
Taylor, D.J, et al. 2000. Biological Science 1 & 2. 3rd edition. Cambridge University Press. Pages 196-198, 268-273.
Mader, Sylvia.S. 2001. Biology. 7th edition. McGraw-Hill companies, Inc. Pages 128-139, and 549.