Prediction
I predict that as the concentration of the hydrogen peroxide increases, the rate of reaction will also increase.
Hydrogen peroxide needs to be decomposed when it is found in cells. It is the substrate in the reaction where hydrogen peroxide is broken down into water and oxygen using catalase.
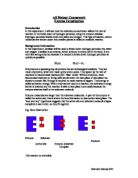
Substrate concentration can affect the rate of reaction. If the concentration of the substrate is low, then there are many active sites that are not in use. This will mean that the reaction rate is low. As the substrate concentration increases, more enzyme-substrate complexes are formed, as there are more active sites. Therefore the rate of reaction would also increase as the substrate concentration increase. However if we keep increasing the concentration of the substrate, there will be a point where the active site of the enzyme is working continuously. Even if the concentration of the substrate is increased, the enzyme will not be able to work any faster than it already is. The enzyme is then said to be working at its maximum possible rate, called Vmax .A typical graph showing the rate of reaction when the concentration of the substrate is varied would therefore look like this:-
Substrate Concentration
(Cambridge Advanced Sciences Biology 1 Endorsed by OCR).
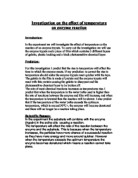
In my experiment the amount of oxygen produced in the break down of hydrogen peroxide using catalase will be measured. The results will show how the rate of reaction is affected by the concentration of the hydrogen peroxide. In a low concentration of the hydrogen peroxide, less oxygen will be produced in a certain time than if a higher concentration of hydrogen peroxide is used. This is how I predict the graph to look like:-
Substrate Concentration
If the amount of oxygen produced is directly proportional to the concentration of the hydrogen peroxide, then it shows that as the substrate concentration increases, the rate of reaction will increase as well.
Controlled Variables
Volume of Hydrogen Peroxide
The volume of hydrogen peroxide needs to be kept the same for all of the experiments. If more hydrogen peroxide is used, then more oxygen will be produced. Therefore the results are not reliable. If the volume is kept the same for each of the repetitions, then the results are reliable as a trend can be seen in the increasing concentration of the substrate. This will be done by using 20mm3 of hydrogen peroxide each time for the experiment for every concentration and repetition.
Batch of Hydrogen Peroxide
The same batch of hydrogen peroxide had been used in different concentrations throughout the experiment. This was to ensure that there were no differences in the batches made. Therefore this would give more reliable results.
Surface Area of Carrot
The surface area of the carrot needs to be kept the same for each of the experiments. This is because if one experiment has a greater surface area of the carrot than another, then the greater surface area of the carrot would give more enzymes and this would increase the rate of the reaction. The results obtained from using different surface areas of carrot would not be reliable and would not help in identifying patterns in the rate of reaction when the substrate concentration has been increased. The surface area will be kept the same by grating the carrots with the same grater. This will ensure that the surface area of the carrot will be kept the same at all times of the experiment.
Mass of Carrot
The mass of the carrot needs to be kept the same throughout the experiment. If a larger mass is used in one experiment, then that would mean that there would be more enzymes and this would speed up the breakdown of hydrogen peroxide. Therefore more oxygen will be produced and this would not enable the results given to show a trend in the rate of reaction when the concentration of the hydrogen peroxide is increased. The mass will be kept the same by using 5g of grated carrot for every repetition with the different concentrations. The carrot will be weighed carefully using an electric weighing scale, as this will give an accurate measure of mass.
Temperature
The temperature of the overall experiment must stay constant. This is because the temperature must not affect the enzyme activity as only the concentration of the substrate is being tested for its effect on rates of reaction. If the temperature is kept constant by a water bath, then the results obtained would be accurate as the temperature will have no effect on the experiment. In the experiment, the test tube which has the catalase from the carrot breaking down the hydrogen peroxide will be kept in a beaker with tap water.
Batch of Carrots
The carrots used must come from the same batch. This is so that different types of carrots are not used; therefore the amount of catalase in the carrot will not be varied. This will be done by using carrots that are non-GM and non-organic. The carrots will come from the same store, so that the batch is kept the same. This is so that the result obtained will be reliable.
Experiment Time
The time that the experiment goes on for as soon as the hydrogen peroxide is put in the test tube with grated carrots needs to be kept the same for every experiment. This so that the results obtained are precise. This will be done by measuring the volume of oxygen produced by the break down of hydrogen peroxide at 60 seconds for each experiment and repetition. This will enable me to find the rate of reaction by seeing how much oxygen is produced in 60 seconds at each of the different concentrations. Therefore I will be able to see if the concentration of the substrate is affecting the rate of the reaction.
List of Apparatus and Materials
- 5 concentrations of hydrogen peroxide
- 1% hydrogen peroxide solution
- 2% hydrogen peroxide solution
- 3% hydrogen peroxide solution
- 4% hydrogen peroxide solution
- 5% hydrogen peroxide solution
- grated carrots
- gas burette
- stand and butterfly clamp
- test tube
- syringe
- beakers
- weighing scales
- rubber bung
- delivery tubes
- test tube rack
- forceps
- stop watch
- weighing boats
- splint
Proposed Method
- Weigh out 5g of grated carrots using the weighing scale and put the weighed amount in the boat dist using forceps.
- Using the forceps put the carrot in the test tube. Use a splint to push the carrot down to the bottom of the test tube.
- Place the test tube in a water bath- a beaker with tap water in.
-
Using the syringe, measure out 20mm3 of the 1% hydrogen peroxide solution.
- Once the hydrogen peroxide has been inserted into the test tube with the carrots, start the stop watch and put rubber bung with delivery tubes attached o top of the test tube.
- At 60 seconds, read off the gas burette the amount of oxygen that has been collected and stop the experiment.
- Repeat this for all 5 concentrations, 3 times each, so that the results obtained are reliable.
Risk Assessment
Throughout the experiment, safety glasses will be worn and care will be taken with the hydrogen peroxide to minimise skin contact with the solution for myself and others. This is because hydrogen peroxide is harmful. The carrot will be grated carefully and not cut into pieces with a knife so that the risk of cut fingers is prevented.
Justification for Materials Used
I decided to use the gas burette in my experiment as it gave a more accurate and precise reading that using a gas syringe would have given. It would also give more reliable results than counting bubbles would have. I decided not to use a manometer because the gas burette gave accurate readings of oxygen collected, therefore it gave accurate results. Also it was easier to use than a manometer.
I used a syringe to measure out the volume of hydrogen peroxide instead of a beaker. This is so that the volume used was accurately measured. Also only a small amount of hydrogen peroxide was needed in the test, so measuring 20mm3 was easier in a syringe than in would have been in a beaker.
The electric weighing scales were used to measure out the grated carrots accurately. This was accurate as the scales gave a mass reading of up to 2 decimal places. The mass of grated carrot used was 5g because I thought that this mass would be enough for the experiment, as only 20mm3 of hydrogen peroxide was going to be used.
The grater was used to ensure that the surface area of the carrot was kept the same throughout the whole of the experiment. This was to make sure the test was fair each time the carrots were used. Also the results given would be reliable as all of the grated carrot would have the same surface area.
The forceps were used so that no skin contact was with the carrots. This way none of the carrots got contaminated, therefore it couldn’t interfere with the experiment. This was the results obtained were precise.
The splint was used to push all of the grated carrots to the bottom of the test tube. This was so that none of the carrots would be left on the sides of the test tube, or this would have given inaccurate results, as not all of the carrot would have been used in the experiment.
A digital stopwatch was used in the experiment to see when it had been 60 seconds after the hydrogen peroxide break down had begun. This is so that the time was taken accurately and it was easier to see when 60 seconds had gone.
Bibliography
Cambridge Advanced sciences biology 1 Endorsed by OCR
Mr Nias’ notes
Table of Results
Table to show the volume of oxygen collected when different concentrations of hydrogen peroxide are broken down using catalase.
Analysis and Conclusions
The results of my experiment show that as the concentration of the substrate, the hydrogen peroxide increased, the amount of oxygen produced also increased. This showed that as the substrate concentration increases, the rate of the reaction does as well. The results show the volume of oxygen collected in 60 seconds. To find the rate of reaction, the average volume of oxygen collected was divided by 60 so that I got the volume of oxygen produced per second. This also showed that as the concentration of the hydrogen peroxide increased, the rate at which it was broken down in per second also increased.
When I produced a graph to show my results, the graph was similar to my predicted graph. It showed an increase in the volume of the product as the substrate increased. 150mm3 of oxygen was produced in 60 seconds with the 5% of hydrogen peroxide solution was breaking down, and 38mm3 of oxygen was produced in 60 seconds with the 1% hydrogen peroxide solution. The graph shows that as the concentration of the substrate increases, the amount of oxygen produced in 60 seconds also increases. The graph also began to look like the ‘typical graph’. The amount of oxygen being produced began so decrease as the concentration increased. When 2% of hydrogen peroxide was used, there was a 36mm3 increase in the volume used from the 1% hydrogen peroxide. When 5% hydrogen peroxide was used, there was a 12mm3 increase in the volume of oxygen produced from the 4% hydrogen peroxide. Therefore it showed that as the concentration of the hydrogen peroxide increased, the pattern in the volume of increasing oxygen begins to reach its Vmax. Therefore the typical graph in my prediction was proved to be correct as the concentration of the substrate can only increase the rate of reaction to a certain amount.
My prediction is correct, in the way that as the concentration substrate increases, so does the rate of reaction. The enzymes do work at a faster rate in a higher substrate concentration solution, because there are more substrate molecules. Therefore the active sites of the enzymes work more. My predicted graph was not completely correct as I had shown in the graph that the concentration of hydrogen peroxide directly proportional to the amount of oxygen collected in 60 seconds. In my experiment, the graph was not completely a straight line, but was beginning to curve at the top where the 5% of hydrogen peroxide was used. This shows that the graph was beginning to look like the typical graph and that the rate of reaction was reaching its Vmax.
My graph is not exactly like the typical graph, in the way the rate of reaction does not reach its maximum working rate. This is because the active sites were not working at its maximum rate even when using the 5% hydrogen peroxide. If a higher concentration solution of hydrogen peroxide was used, e.g. such as 15%, then the rate of reaction would still be quite high, but would begin to level of in the graph, because the active sites would be working continuously.
In conclusion, I can tell that my results and graph support the prediction I had made. The rate of reaction does increase when the concentration of the substrate increases. In my experiment, as the concentration of the hydrogen peroxide solution was increased, more oxygen was produced in a certain time. The reason for this is because in a low concentration of the hydrogen peroxide solution, many of the active sites of the enzymes are not in use; therefore the reaction is generally slower. When a solution of higher concentration of the hydrogen peroxide is used, the active sites of the enzymes are more in use, therefore the reaction is faster. However if the experiment had been continued with increasing concentrations of the hydrogen peroxide, I am sure that the rate of reaction would reach its maximum working rate and the rate of reaction would not go any higher. This is because the enzymes would not be able to work any more than they are at that point.
Evaluation
I think that my experiment of seeing how the concentration of the substrate affected the rate of reaction. The results of my experiment did prove my prediction to be correct and my prediction was supported my scientific evidence that had shown that as the substrate concentration was increased, the rate of reaction would also increase. The higher the concentration of the hydrogen peroxide was the more oxygen was produced in 60 seconds. The rate of reaction for the break down of hydrogen peroxide using catalase was found by dividing the average volume of oxygen collected in 60 seconds by 60. This gave the volume of oxygen collected per second.
Anomalous Results
My results for my experiment did not have any major anomalous results. There were minor variations in my repetition results in each of the concentrations. Therefore my results are shown to be quite reliable.
Sources of Error
Other factors could have caused the variations I my results. The results could have been varied for many reasons.
The temperature of the test tube where the experiment took place as kept constant by a water bath with tap water in it. The temperature of the tap water could have changed as the experiment had gone on, as the water in the beaker could have gone cold over time. Also the weather on the day the experiment had taken place may have affected the temperature of the water. The temperature of the atmosphere of the room could also have affected the temperature of the experiment, as a warmer room could have warmed up the carrot and hydrogen peroxide solution.
If the temperature had been affected by these sources, then the rate of reaction would have been altered, as the way in which the enzymes are sensitive to the temperature.
Another source of error could have been the way the carrot had been weighed out. Even though an electric scale was used, errors in the mass of the carrot could have been made, as I had weighed out the 5 grams quickly, I could have added or missed out up to 0.5 grams of carrot without noticing. This could have affected the accuracy of the results, as more carrots would have given more enzymes to increase the rate of reaction and less carrot would have given less carrot to decrease the rate of reaction. Therefore my results would not have been as accurate as I would have wanted it to be.
The volume of the hydrogen peroxide may not have been measured accurately because it had been measured by a syringe. This is because since only 20 mm3 of the hydrogen peroxide was required for each of the experiments, errors could have been made in the measuring because my vision had been judging when 20 mm3 had been measured. Therefore an extra mm3 of hydrogen peroxide could have been taken. More of the substrate molecules could affect the rate of reaction; therefore my results would not have been as accurate as I would want them to be.
One of the major sources of error would have come from measuring the volume of oxygen after 60 seconds the bond destruction had taken place. This is because I had to watch the stop watch and when it had been 60 seconds; I had to quickly record the volume of oxygen that had been produced. Errors that could have been made in this process is that the reaction kept going on in the test tube, and I could have made an incorrect reading at the burette as oxygen was still being collected in the burette.
The carrots could have been contaminated by skin contact when the carrots had been grated. This could also have affected the results and would have been reliable.
Accuracy and Reliability of Results
I think that my results are fairly accurate as they have shown my prediction to be true. It has also proved the background information to be true. Even though there may have been errors in my experiment, my results are accurate because my repetitions of my experiment have been consistent and are quite close together.
I think my results are quite reliable, even though there were some sources of error. This is because I did do three repetitions of my experiment. They all had similar results. Also I did not have any anomalous results, therefore I think my experiment went well and my results are reliable.
Limitations and Technique
In my experiment, I had been limited with time. If I did have more time, I would have done each experiment slower and this may have reduced the sources of error. This would have made my results more accurate and reliable.
My method of measuring the amount of oxygen produced in the break down of hydrogen peroxide could have been better. This is because I had to insert the hydrogen peroxide in the test tube, start the stop watch, and seal the test tube with the rubber bung and delivery tubes all at the same time and this could have led to some error.
Improvement
I would improve my experiment by using more care in accurately measure out the carrot and hydrogen peroxide, therefore the sources of error would be reduced.
Also I would remove the rubber bung from the test tube when it had been 60 seconds after the experiment had begun. This is so that even when the reaction is going on, no more oxygen can be collected in the gas burette, therefore I would have a more accurate reading of the oxygen collected.
I would also use gloves when the carrot would be grated so that the carrots would not be contaminated by skin contact.
Instead of a beaker of tap water, I would use a proper water bath that would always be kept at a constant temperature. This way the temperature would not change and will not affect the reaction.
Validity of Conclusion
I think my prediction is acceptable. It had been backed up with scientific information. My results and graph had also proved my prediction to be correct, as it had shown similar trends with my predicted graph and the typical graph. The results had shown exactly what I had written in the prediction.