name enzyme was suggested in 1867 by the German physiologist Wilhelm Kühne (1837-1900); it
is derived from the Greek phrase en zyme, meaning "in leaven." Those enzymes identified now
number more than 700.
Enzymes are classified into several broad categories, such as hydrolytic, oxidizing, and reducing,
depending on the type of reaction they control. Hydrolytic enzymes accelerate reactions in which
a substance is broken down into simpler compounds through reaction with water molecules.
Oxidizing enzymes, known as oxidases, accelerate oxidation reactions; reducing enzymes speed
up reduction reactions, in which oxygen is removed. Many other enzymes catalyze other types of
reactions.
Individual enzymes are named by adding ase to the name of the substrate with which they react.
The enzyme that controls urea decomposition is called urease; those that control protein
hydrolyses are known as proteinases. Some enzymes, such as the proteinases trypsin and
pepsin, retain the names used before this nomenclature was adopted.
Properties of Enzymes
As the Swedish chemist Jöns Jakob Berzelius suggested in 1823, enzymes are typical catalysts:
they are capable of increasing the rate of reaction without being consumed in the process. See
Catalysis.
Some enzymes, such as pepsin and trypsin, which bring about the digestion of meat, control
many different reactions, whereas others, such as urease, are extremely specific and may
accelerate only one reaction. Still others release energy to make the heart beat and the lungs
expand and contract. Many facilitate the conversion of sugar and foods into the various
substances the body requires for tissue-building, the replacement of blood cells, and the release
of chemical energy to move muscles.
Pepsin, trypsin, and some other enzymes possess, in addition, the peculiar property known as
autocatalysis, which permits them to cause their own formation from an inert precursor called
zymogen. As a consequence, these enzymes may be reproduced in a test tube.
As a class, enzymes are extraordinarily efficient. Minute quantities of an enzyme can accomplish
at low temperatures what would require violent reagents and high temperatures by ordinary
chemical means. About 30 g (about 1 oz) of pure crystalline pepsin, for example, would be
capable of digesting nearly 2 metric tons of egg white in a few hours.
The kinetics of enzyme reactions differ somewhat from those of simple inorganic reactions. Each
enzyme is selectively specific for the substance in which it causes a reaction and is most
effective at a temperature peculiar to it. Although an increase in temperature may accelerate a
reaction, enzymes are unstable when heated. The catalytic activity of an enzyme is determined
primarily by the enzyme's amino-acid sequence and by the tertiary structure-that is, the three-
dimensional folded structure-of the macromolecule. Many enzymes require the presence of
another ion or a molecule, called a cofactor, in order to function.
As a rule, enzymes do not attack living cells. As soon as a cell dies, however, it is rapidly
digested by enzymes that break down protein. The resistance of the living cell is due to the
enzyme's inability to pass through the membrane of the cell as long as the cell lives. When the
cell dies, its membrane becomes permeable, and the enzyme can then enter the cell and destroy
the protein within it. Some cells also contain enzyme inhibitors, known as antienzymes, which
prevent the action of an enzyme upon a substrate.
Practical Uses of Enzymes
Alcoholic fermentation and other important industrial processes depend on the action of enzymes
that are synthesized by the yeasts and bacteria used in the production process. A number of
enzymes are used for medical purposes. Some have been useful in treating areas of local
inflammation; trypsin is employed in removing foreign matter and dead tissue from wounds and
burns.
Historical Review
Alcoholic fermentation is undoubtedly the oldest known enzyme reaction. This and similar
phenomena were believed to be spontaneous reactions until 1857, when the French chemist
Louis Pasteur proved that fermentation occurs only in the presence of living cells (see
Spontaneous Generation). Subsequently, however, the German chemist Eduard Buchner
discovered (1897) that a cell-free extract of yeast can cause alcoholic fermentation. The ancient
puzzle was then solved; the yeast cell produces the enzyme, and the enzyme brings about the
fermentation. As early as 1783 the Italian biologist Lazzaro Spallanzani had observed that meat
could be digested by gastric juices extracted from hawks. This experiment was probably the first
in which a vital reaction was performed outside the living organism. After Buchner's discovery
scientists assumed that fermentations and vital reactions in general were caused by enzymes.
Nevertheless, all attempts to isolate and identify their chemical nature were unsuccessful. In
926, however, the American biochemist James B. Sumner succeeded in isolating and
crystallizing urease. Four years later pepsin and trypsin were isolated and crystallized by the
American biochemist John H. Northrop. Enzymes were found to be proteins see Protein, and
Northrop proved that the protein was actually the enzyme and not simply a carrier for another
compound.
Research in enzyme chemistry in recent years has shed new light on some of the most basic
functions of life. Ribonuclease, a simple three-dimensional enzyme discovered in 1938 by the
American bacteriologist René Dubos and isolated in 1946 by the American chemist Moses
Kunitz, was synthesized by American researchers in 1969. The synthesis involves hooking
together 124 molecules in a very specific sequence to form the macromolecule. Such syntheses
led to the probability of identifying those areas of the molecule that carry out its chemical
functions, and opened up the possibility of creating specialized enzymes with properties not
possessed by the natural substances. This potential has been greatly expanded in recent years
by genetic engineering techniques that have made it possible to produce some enzymes in great
quantity (see Biochemistry).
The medical uses of enzymes are illustrated by research into L-asparaginase, which is thought to
be a potent weapon for treatment of leukemia; into dextrinases, which may prevent tooth decay;
and into the malfunctions of enzymes that may be linked to such diseases as phenylketonuria,
diabetes, and anemia and other blood disorders.
I have to plan and carry out an experiment to investigate the way in which concentration of a
substrate affects the rate of an enzyme-catalysed reaction. I will need to carry out some
background information to find out what may affect my experiment.
Background Information:
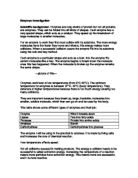
An enzyme is a biological catalyst. They speed up the rate of a reaction however they are not
affected themselves whilst doing this, this is why they are catalysts. Enzymes are made to be
specific, this means that they can have only one substrate that they will work on. Each enzyme
has an active site that is where their own specific ...
This is a preview of the whole essay
substrate affects the rate of an enzyme-catalysed reaction. I will need to carry out some
background information to find out what may affect my experiment.
Background Information:
An enzyme is a biological catalyst. They speed up the rate of a reaction however they are not
affected themselves whilst doing this, this is why they are catalysts. Enzymes are made to be
specific, this means that they can have only one substrate that they will work on. Each enzyme
has an active site that is where their own specific substrate's molecule will fit into. Enzymes all
work best at an optimum temperature that is usually body temperature at 37C. If the
temperature that the enzyme has to work at gets too high, normally 40C it will start to become
denatured and therefore no longer work on its substrate as the active site has changed shape.
Also enzymes usually work best at an optimum pH level, this is normally 7 because enzymes are
proteins which are damaged by very acidic or very alkaline conditions.
Most reactions work better at higher temperatures, this is because molecules move around
much quicker. This makes the molecules have more chance to collide with the substrate. With
more collisions there is more chance of a reaction taking place. This makes the rate of reaction
faster. At 40C the enzyme starts to be damaged, this slows down the reaction and by around
60C the enzyme will be completely destroyed.
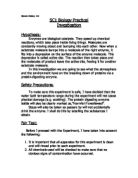
Plan:
Safety/Fair:
For this test I will have to make sure everything is done with safety and fairness. Throughout the
whole experiment safety glasses must be worn, as Hydrogen Peroxide can be dangerous if it
gets into your eyes. All other Lab rules must be followed also. To make sure the experiment is
fair I must make sure nothing is changed for different experiments. I will use the same apparatus
for each different experiment and I will make sure the same types of celery and Hydrogen
Peroxide are used. The equipment should be kept the same to ensure all results are taken
without any advantages or disadvantages. Everything in the experiment should be kept the same
apart from the concentration of the Hydrogen Peroxide. Each time the celery will be replaced
with another 1g of celery, as it will have been used to react with the Hydrogen Peroxide in the
experiment before. The mash will be kept covered as much as possible and will only make
contact with the Hydrogen Peroxide when the stopwatch is started. When the celery is
measured out on the scales some polythene will be placed under it so that none of the mash is
absorbed into the scales. All measurements of mash will be made to 2d.p. This will increase
accuracy because the minimum and maximum it can weigh will be 0.995g and 1.005g. If it was
measured to the nearest gram, the measurements could be from 0.5g to 1.5g which would be
totally inaccurate and would make the experiment unfair as amounts could vary hugely.
Preliminary Work:
I chose to use the different apparatus in my experiment from preliminary work I have done. I
could have used liver instead of celery but liver reacts too much too quickly to be able to record
the results with any accuracy. This is because it has too many catalaes, so the reactions are
made a lot quicker. Once I had chose patatoe I had the choice of patatoe puree or boiled
patatoe , this was an easy choice because if I had used boiled patatoe I would have had no
reactions because the enzymes would have denatured due to the high temperatures. Denaturing
is when the enzyme loses its shape and cannot work on its substrate. Instead of using a
measuring cylinder I could have used a more accurate gas syringe, I couldn't do this however
because they are expensive, therefore not widely available to use. Also the pushing of the
oxygen would probably have been too weak to push the syringe enough to record the results.
There was a choice between counting the number of bubbles released and the volume of oxygen
released. I chose volume because it is more accurate as bubbles can easily vary in size and it is
easier to record the volume than counting bubbles.
g of the celery and 5cm of the Hydrogen Peroxide should be enough for this experiment to
produce easily read results, which will also be accurate enough for me to see clearly which is
best for reactions.
Method:
The first thing I will do will be to put on my safety glasses as this test needs to be made safe
before anything can be done. I will then get the equipment I need for the experiment. The
equipment I will use is a water basin, a conical flask, a bung, a delivery tube, a measuring
cylinder, a syringe, a spatula and a stopwatch. Then I will collect the concentration of Hydrogen
Peroxide I will need for the experiment I will be doing; also 1g of patatoe will be measured out
with the syringe , this will be measured to 2 decimal places as that is what the scales measure in.
This is accurate enough for the experiment I will do. I will fill the basin with water next and then
fill the measuring cylinder as well. The measuring cylinder will be placed upside down in the
basin still full of water, making sure that no water is escapes so that the experiment is fair. I will
then stick the liquidated patatoe to the side of the conical flask; this will be done using a spatula.
The next thing that must be done is to put the delivery tube and bung together and place the
delivery tube under the measuring cylinder so that any gas pushed through will go into the
measuring tube. 5cm of Hydrogen Peroxide will then be measured out using a syringe. This will
then be put into the conical flask very carefully; making sure that it doesn't mix with the celery,
then the bung will be put into the conical flask. If the two mix I will have to wash out the flask
and start again with new hydrogen peroxide and new patatoe , as the reactions will have started
without the amount of oxygen being recorded. The measuring tube will be kept in place by hand
and then simultaneously the flask will be shook, mixing the celery and Hydrogen Peroxide, and
the stopwatch will be started. Measurements will be taken from the side of the measuring
cylinder every 30 seconds and noted down. All measurements will be made as precise as
possible to keep the experiment accurate and fair.
Prediction:
I would expect from this reaction that the quickest and most reacted concentration would be the
00%. I would then expect 75%, 50%, 25% and then the slowest to react would be the 10%
concentration.
I would expect 100% to react quickest because it has the most Hydrogen Peroxide molecules
in it. With more of these molecules inside the solution, it is more likely that a collision will take
place, molecules must collide in order to react. This means that a reaction is more likely to take
place, in a shorter time, making the rate of reaction quicker. More collisions are needed
because only one in every 10 to the 14 collisions lead to a successful reaction taking place. The
more reactions that take place increases the amount of oxygen produced in the shortest time.
The orders of reaction starting with the fastest are as follows: 100%
75%
50%
25%
0%
Results:
The results I gained from the experiment are shown in the tables below, the first show all the
results for each experiment. The last shows the average figures from all 3 experiments.
Conclusion:
My results show me that the higher the concentration of a substrate, the quicker the reaction
rates of that substrate and the enzyme working on it. The 100% concentration produced the
most 02 in the shortest time, which gives it a higher reaction rate than the others. This shows that
my prediction was correct, the highest concentration would produce the most 02 in the shortest
time. Also the anticipated results I produced in my plan were correct, as the lines are almost
identical to the lines produced in my results. The next highest reaction rate is the 75%
concentration, this is because it had the second highest concentration therefore there would have
been the second most amount of collisions. As my prediction and background information
show, more collisions produces more reactions. The results then show that in order the reaction
rate gets lower as each concentration gets lower. My graphs also show that the reaction rate for
!00% concentration is quickest because it's line is steepest therefore it shows once again that
more O2 was produced in a shorter time.
My results support my prediction, because as I said, the higher concentration the quicker more
of the O2 is produced. Therefore my prediction was correct, from what my results show.
Evaluation:
From my results I have found that the higher the concentration of Hydrogen Peroxide, the
quicker the reaction rates, producing oxygen.
I have succeeded in what I planned to do, which was to find out how the concentration of
H2O2 affects the amount of oxygen produced in an enzyme catalysed reaction. The results I got
were what I had expected and predicted and I did not get any anomalous results. The results I
got were what I wanted so I was fairly happy with them.
The experiment could have been made more accurate by using other ways of doing things that
were important to the experiment. More accurate measurements could have been used as the
measuring cylinders used were only to either every 0.5cm2 or 1cm2. This is not really very
accurate. Using a gas syringe, which measures much more accurately, could have solved this.
Another inaccuracy is when the experiment was started, the measuring cylinder may have still
had some air bubbles inside it, this is not fair as air is not pure oxygen, it also has CO2 and
Nitrogen in it. This makes the results slightly less accurate. Another thing is that when the celery
and the Hydrogen Peroxide were put into the flask, they may have mixed slightly causing some
oxygen to be lost.
I feel my experiment was a good procedure to use because it gave good results that were
similar to what I had expected. Other ways to make it more accurate would be to only use the
juices formed when the patatoe was mashed up, this is the area which contains the enzymes,
not the cell wall which was also present in the patatoe we used. Sometimes we could have had
totally juice for the experiment but other times it could have been mostly cell wall, this would
have affected the results. The results may be inaccurate because the experiments were done on
two different days, which means two different celery plants were used. Therefore one could
have contained more catalase than the other, making results inaccurate. I also know that the
temperature can effect the rate of a reaction. The temperature was not the same on both days
so this may have changed the results slightly. The enzymes may have denatured in some
experiments because of the celery being exposed to the air, some people may not have sealed
the container properly. This experiment could be furthered by using more accurate data-loggers
that would provide more accurate results, taken at every exact 30 seconds. Also a different
machine could have been used to measure the exact amount of enzymes in each experiment.
Also more substrate concentrations could have been used to prove the whole experiment was
correct. Another thing to be done would be to do more repeats for each concentration, this
would make results more accurate when finding averages. This experiment could also be done
the same except changing something else each time, like the amount of patatoe , keeping the
same concentration of the substrate.
AIM
Effect of temperature of the action of the Enzyme Catalase.
PLANNING
Background Knowledge
An enzyme is a biological catalyst, it alter the rate of reaction without being changed itself.
Enzymes are proteins; they have a very precise three-dimensional shape, which forms a one
specific active site on the enzyme. Each enzyme can only convert one kind of substrate molecule
in to one kind of product molecule. These are specific.
What affects Enzymes?
· Temperature- Enzymes stop working if the temperature rises above 40°C. Increasing the
temperature alters the 3D shape and so the enzyme can no longer fit the substrate.
· pH- They work best in neutral conditions neither acidic nor alkaline.
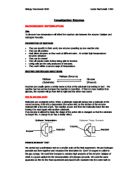
What affect does catalase have?
Catalase is a very fast reacting enzyme, it is found in many living cells, it breaks down hydrogen
peroxide to water and oxygen. In fact one molecule of it can deal with six million molecules of
hydrogen peroxide in 1 minute. Hydrogen peroxide is toxic so needs to be changed into
harmless substances.
Catalase
Hydrogen peroxide water + oxygen
2H2O2 2H2O + O2
References to practicals referring to enzymes
· Biology for You Pg 30 - Experiment 3.1
From looking at this I found out that catalase reacts with hydrogen peroxide to give out water
and oxygen. Oxygen bubbles produce froth on the surface of the solution. In my forthcoming
experiment I will expect to see froth being produced.
· Biology- Nelson Science Pg 25 - Picture 4
From looking at this graph, see below. I have learnt that the affect of temperature does in fact
change the rate of reaction. From the graph the reaction reaches 40°C but then denatures and
the rate of the reaction decreases. The rate falls rapidly suggesting denaturing.
Taking this information into account I would expect the enzyme catalase to show a similar
pattern with respect to the temperature.
In order to observe the effect of temperature on catalase we will be maintaining in the amount of
oxygen released. The oxygen produces a froth which we will then measure in mm and the
volume of oxygen given off which will be measure in cm³
Method- measuring the height of froth and volume of oxygen
. Put work shirt on and goggles on. Carry out the rest of safety precautions.
2. Gather equipment as shown on diagram1.
3. Using a cork borer make 5 cylinders from the large potato.
4. Cut them into all the same length (6cm)
5. Using a pestle and mortar mash up each cylinder separately.
6. Measure 25ml of hydrogen peroxide using a measuring cylinder.
7. Select the temperature you are going to study
0°C- iced water
25°C-no extra equipment
37°C-water bath required
55°C-water bath required
00°C-beaker of boiling water
8. Place on mashed cylinder into a boiling tube add the measured hydrogen peroxide and attach
the rubber bung connected to the measuring syringe.
9. Start stop watch and record volume of gas collected every 30 seconds. At the same time
measure the amount of froth produced at 30 seconds intervals
Apparatus
· 5 beakers
· 5 test tubes
· Thermometers
· Cork borer
· Potato
· Ruler
· Knife
· Tile
· Measuring syringe
· Heat proof mat
· Bunsen burner
· Tri-pod
· Wire gauze
· Pestle and mortar
· Hydrogen peroxide
· Matches
· Spills
· Ice cubes
· Water bath
· Goggles
· Spatula
· Stopwatch
· Measuring cylinder
Fair test
In this investigation I will keep constant the following
· The surface area of the potato. I will use the mashed up form as it will be a faster reaction as
there is more area to react on, as we have to consider the time span.
· The same volume of hydrogen peroxide in each part of the investigation.
· The same size equipment e.g. boiling tubes as the readings for the results will be wrong if this is
not constant.
· Use the same method for each experiment so that there won't be any major differences. Only
alter the temperature.
· Keep the amount of potato the same amount.
· Measure the temperature with a thermometer.
Accuracy
In order to make my investigation go to plan I will be as accurate as I can be so I will measure
to the correct measuring size.
· Measure the volume in cm³ and amount of potato in grams to make sure that they are exactly
the same mass before using them in the experiment.
· Do the experiment three times to ensure that there isn't an odd result. Three is a good number
to use as you can see if there is one odd one where if you just done the experiment twice then
you wouldn't know which one odd and which isn't.
· Also to average out the results.
Safety precautions
· Wear goggles
· Tuck tie in skirt
· Wear work shirt
· Handle the hydrogen peroxide with care as it is corrosive and an irritant
Predictions and Reasons
From my research I think that the enzymes will denature after 40°C and any other temperature
above that. Reason being that enzymes are proteins and their structure is three-dimensional.
Increasing the temperature disturbs the intra molecular bonds that hold the 3D shape. Because
of this the shape is altered. Enzymes have an active site. This fits into the substrate molecular
(see diagram2-lock and key). If the active site is altered the substrate will no longer fit in and so
the enzyme doesn't work properly.
The rise of reaction rate is also due to the increase in temperature, relating to the kinetic theory.
The higher the temperature, the faster they move. This happens but only to an optimum of 40°C.
The curve leading up to the optimum point is gradual but as it is reached it falls dramatically. The
reason being that the active site is destroyed therefore no reaction can take place as there is
only one specific active site per substrate.
OBTAINING EVIDENCE
Below are my table of results which show the height of froth produced in cm and the volume of
oxygen in cm³ for each of the three tests at each of the five temperatures studied.
TEMPERATURE: 10°C
TEST 1 TEST2 2 TEST 3
TIME (mins) HEIGHT OF FROTHcm VOLUMEOF OXYGEN(cm³) HEIGHT OF
FROTHcm VOLUMEOF OXYGEN(cm³) HEIGHT OF FROTHcm VOLUMEOF
OXYGEN(cm³)
0.5 3 3 2.4 9 2 4
3.7 6 3 10 3 8
.5 4.2 8 3.3 11 4.3 12
2 4.8 10 3.5 12 5.4 12
2.5 5.3 11 3.9 13 6 12
3 5.7 12 4 13 6.2 13
3.5 6.5 12 4.2 13 7.4 13
4 6.8 13 4.4 13 8 14
4.5 7.5 13 4.4 13 8 14
5 8.2 13 4.4 13 8 14
TEMPERATURE: 25°C
TEST 1 TEST2 2 TEST 3
TIME(mins) HEIGHT OF FROTHcm VOLUMEOF OXYGEN(cm³) HEIGHT OF
FROTHcm VOLUMEOF OXYGEN(cm³) HEIGHT OF FROTHcm VOLUMEOF
OXYGEN(cm³)
0.5 3 9 4 5 3 8
5 14 6 10 4.9 12
.5 6 18 6.5 14 5.8 15
2 7.5 20 7 18 7.6 19
2.5 9 20 8 20 8.2 20
3 10 20 9 21 9.1 21
3.5 10 20 9 21 10 22
4 10 20 9 21 10 22
4.5 10 20 9 21 10 22
5 10 20 9 21 10 22
TEMPERATURE: 37°C
TEST 1 TEST2 2 TEST 3
TIME(mins) HEIGHT OF FROTHcm VOLUMEOF OXYGEN(cm³) HEIGHT OF
FROTHcm VOLUMEOF OXYGEN(cm³) HEIGHT OF FROTHcm VOLUMEOF
OXYGEN(cm³)
0.5 4 7 5 12 4.5 10
5.5 14 8 20 6 16
.5 7 19 10 26 8 22
2 9 22 11 28 10 26
2.5 10 28 12 30 11 28
3 10 28 12 30 11 28
3.5 10 28 12 30 11 28
4 10 28 12 30 11 28
4.5 10 28 12 30 11 28
5 10 28 12 30 11 28
TEMPERATURE: 55°C
TEST 1 TEST2 2 TEST 3
TIME(mins) HEIGHT OF FROTHcm VOLUMEOF OXYGEN(cm³) HEIGHT OF
FROTHcm VOLUMEOF OXYGEN(cm³) HEIGHT OF FROTHcm VOLUMEOF
OXYGEN(cm³)
0.5 4 12 5 14 6 15
6 18 6 19 7 20
.5 7 22 6.5 22 8 22
2 8 24 8 24 8 24
2.5 8 25 8 25 8 25
3 8 26 8 25 8 26
3.5 8 26 8 26 8 26
4 8 26 8 26 8 26
4.5 8 26 8 26 8 26
5 8 26 8 26 8 26
TEMPERATURE : 100°C
TEST 1 TEST2 2 TEST 3
TIME(mins) HEIGHT OF FROTHcm VOLUMEOF OXYGEN(cm³) HEIGHT OF
FROTHcm VOLUMEOF OXYGEN(cm³) HEIGHT OF FROTHcm VOLUMEOF
OXYGEN(cm³)
0.5 0.1 0.5 0.1 1 0.1 1
0.1 0.5 0.1 1 0.1 1
.5 0.1 0.5 0.1 1 0.1 1
2 0.1 0.5 0.1 1 0.1 1
2.5 0.1 0.5 0.1 1 0.1 1
3 0.1 0.5 0.1 1 0.1 1
3.5 0.1 0.5 0.1 1 0.1 1
4 0.1 0.5 0.1 1 0.1 1
4.5 0.1 0.5 0.1 1 0.1 1
5 0.1 0.5 0.1 1 0.1 1
AVERAGES
Table of averages from each of the above temperatures
TEMPERATURE: 10°C
TIME(mins) HEIGHT OF FROTHcm VOLUMEOF OXYGEN(cm³)
0.5 2.5 5.0
3.2 8.0
.5 3.9 10.3
2 4.6 11.3
2.5 5.1 12.0
3 5.3 12.7
3.5 6.0 12.7
4 6.4 13.3
4.5 6.6 13.3
5 6.9 13.3
TEMPERATURE: 25°C
TIME(mins) HEIGHT OF FROTHcm VOLUMEOF OXYGEN(cm³)
0.5 3.3 7.3
5.3 12.0
.5 6.1 15.7
2 7.4 19.0
2.5 8.4 20.0
3 9.4 20.6
3.5 9.7 21.0
4 9.7 21.0
4.5 9.7 21.0
5 9.7 21.0
TEMPERATURE: 37°C
TIME(mins) HEIGHT OF FROTHcm VOLUMEOF OXYGEN(cm³)
0.5 4.5 9.7
6.5 16.6
.5 8.5 22.3
2 10 25.3
2.5 10 28.7
3 10 28.7
3.5 10 28.7
4 10 28.7
4.5 10 28.7
5 10 28.7
TEMPERATURE: 55°C
TIME (mins) HEIGHT OF FROTHcm VOLUMEOF OXYGEN(cm³)
0.5 5.0 13.7
6.3 19.0
.5 7.1 22.0
2 8.0 24.0
2.5 8.0 25.0
3 8.0 25.7
3.5 8.0 26.0
4 8.0 26.0
4.5 8.0 26.0
5 8.0 26.0
TEMPERATURE: 100°C
TIME (mins) HEIGHT OF FROTHcm VOLUMEOF OXYGEN(cm³)
0.5 0.1 0.83
0.1 0.83
.5 0.1 0.83
2 0.1 0.83
2.5 0.1 0.83
3 0.1 0.83
3.5 0.1 0.83
4 0.1 0.83
4.5 0.1 0.83
5 0.1 0.83
These two tables show the average measurement that we recorded for each temperature.
HEIGHT
Time (mins)
Temperature (°C) 0 0.5 1 1.5 2 2.5 3 3.5 4 4.5 5
0°C 0 2.5 3.2 3.9 4.6 5.0 5.3 6.0 6.4 6.6 6.9
25°C 0 3.3 5.3 6.1 7.4 8.4 9.4 9.4 9.4 9.4 9.4
37°C 0 4.5 6.5 8.5 10 10 10 10 10 10 10
55°C 0 5.0 6.3 7.1 8 8 8 8 8 8 8
00°C 0 0.1 0.1 0.1 0.1 0.1 0.1 0.1 0.1 0.1 0.1
VOLUME
Time (mins)
Temperature (°C) 0 0.5 1 1.5 2 2.5 3 3.5 4 4.5 5
0°C 0 5.3 8 10.3 11.3 12 12.7 12.7 13.3 13.3 13.3
25°C 0 7.3 12 26.7 19 20 20.6 21 21 21 21
37°C 0 9.7 16.6 22.3 25.3 26.7 26.7 26.7 26.7 26.7 26.7
55°C 0 13.7 19 22 24 25 26.7 26 26 26 26
00°C 0 0.8 0.8 0.8 0.8 0.8 0.8 0.8 0.8 0.8 0.8
Analysing results and Conclusion
From my results it appears that catalase works best at 37°C, and it is virtually denatured at
boiling point.
Looking at the initial part of the reaction (see graph 1) it is clear that the gradient at the
beginning gets steeper when looking at the temperatures between 10°C-55°C. At each
temperature the line levels off towards the end of five minutes. Looking at graph 2, there is a
steady rise in height of froth up to 37°C and then a gradual fall up to 100°C.
Looking at my background knowledge and prior experiments using enzymes I can explain my
results as follows.
Kinetic theory states that particles, which gain heat energy, move more quickly. In our case the
reacting particles are the substrate (hydrogen peroxide) and the enzyme catalase. As the
temperature is increased the particles of hydrogen peroxide have more energy therefore they
collide with the potato more frequently and so increasing the rate at which the product is
formed. However at a certain temperature this is no longer the case. This is because enzymes
are proteins and proteins can be denatured at high temperatures. This is because proteins have a
3D shape. In our case the catalase has a certain shape that the substrate fits into. At high
temperatures the active site on the enzyme is altered, see diagram below.
(Diagram showing active site on the enzyme is altered therefore stopping products being
formed)
This stops the substrate from 'fitting' and so no product is formed.
My results do not totally support or undermine my original prediction. The reason being that on
graph 1, my results suit my prediction. It shows that the temperature, 37°C was the fastest and
00°C is when the enzyme denatures. But in graph 2, my results undermine my original
prediction as at 55°C the reaction still takes place where as in my prediction I stated that
enzymes would denature at 40°C approximately, I didn't expect this is happen.
Evaluation
In my investigation I was pleased with my achievements.
In my method, keeping the temperature constant throughout the investigation was hard to
maintain, as the temperature of the contents of the tube would change quite quickly and
therefore the hydrogen peroxide wouldn't be at the temperature required. To overcome this
problem I could keep the test tubes in a hot water bath for all the temperatures making sure that
the water bath was the suitable depth. This would ensure constant temperature throughout the
whole 5 mins. Also another problem that I encountered was to keep the height of the froth fair. I
measured the height of the froth with a 30cm ruler against the test tube rack, with the support of
my hand. As I was measuring, my hand would move from time to time and therefore didn't
know where I should place my ruler afterwards. To over come this I should attach the ruler
onto the test tube rack with cello tape, as it is transparent or maybe use a pointer.
With respect to I measured the height of froth in cm, but to be more precise I should have
measured it in mm. To over come this I should use a ruler with mm readings. Also another
problem that I observed on accuracy was that I didn't allow the temperature to equilibrate to
the right temperature. In this case I wasn't using the correct temperature that I wanted, this
could have led to some anomalous results. Ideally I should have brought the temperature of the
hydrogen peroxide up to the needed temperature before adding to the potato.
Looking back at my results I found some anomalous results in my findings. When averaging I
used these results, which could of made the average either lower or higher than it should be. To
improve this I should have missed these results. Not including some sets of results when making
averages may have led to better values.
My results are in line with those I predicted. Graphs indicate rise in temperature up a point leads
to an increase in oxygen production. This is in line with kinetic theory. However it is very clear
that after a certain temperature is reached the enzyme actually virtually stops. This supports my
theory of lock and key fit.
However optimum activity of enzyme is at about 37°C this is as we expected. But at 55°C the
enzyme is still not denatured according to my results. This is a higher temperature than I would
expect. Possible not allowing solutions to reach temperatures selected has led to an inaccuracy.
It may be that in fact that many temperatures of solutions were lower than we stated.
Overall, due to reliable repeats and in general predictions being confirmed I feel my results are
reliable enough to make a conclusion.
The obvious thing I would improve about the measurements I made would be to increase the
range of temperatures used. Especially between 55°C-100°C. In this way it may be clearer at
the temperature which denaturing took place, and would possibly give a graph that resembled
the graph in background knowledge.
Another way of improving this investigation is to change the method. I measure the volume of
oxygen that was produced. In order to get pure oxygen without any other gases that are in the
air I would use the same equipment but make sure that the gap between the rubber bung and
solution was free from any other gases.