Experiment to obtain curves which show how the pH changes during an acid-base titration and;To use these curves to choose suitable indicators for different combinations of acid and alkali.
Experiment 15 23-3-99
Aim:
- To obtain curves which show how the pH changes during an acid-base titration and;
- To use these curves to choose suitable indicators for different combinations of acid and alkali.
Procedure:
- 25.0cm3 of 0.100 M ethanoic acid was pipetted into a 100cm3 beaker, a small stirring paddle was added, and the beaker was stood on a magnetic stirrer.
- The electrode of a pH meter was carefully clamped so that the bulb is completely immersed in the acid and is clear of the stirring paddle. If a magnetic stirrer (or mechanical stirrer) is not available, it is better to swirl the beaker by hand. If a pH meter is not available, it is better to use a conical flask rather than a beaker.
- A burette with 0.100M ammonia solution was filled and was clamped over the beaker (or flask) containing the acid.
- A value of the pH of the acid was obtained, either by reading the pH meter (which must, of course, have been calibrated) or by removing 1 small drop on a thin glass rod and testing with narrow range indicator paper. If which range to use was not known, it is first tested with full range universal indicator paper. However, it is important not to remove more than the minimum acid from the flask.
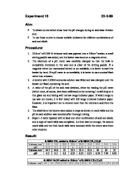
- The alkali form the burette were added in steps as shown in result table and the pH at each addition was recorded after thorough mixing.
- Steps 1~5 were repeated with at least one other combination of acid and alkali, and a copy of result table was completed. As time was not enough, the second result table and the third result table were recorded while the others were from other students.