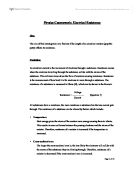
The equipment used for the experiment will be
- Power source/battery to give a current
- Digital ammeter
- Digital voltmeter
- Variable resistor
- Unknown resistor
- Beaker full of water
- Connecting wires
- Thermometer to make sure the temperature is constant.
Digital meters will be used instead of analogue meters because they give better accuracy.
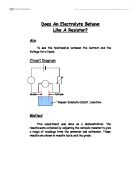
The equipment will be set up as shown below:
The voltmeter needs to be in parallel to the resistor because it has to measure voltage change across the resistor.
The ammeter can be anywhere in the main circuit provided that it is in series. If the ammeter was in parallel the reading would be incorrect.
The variable resistor is also in series because it’s needed to influence the voltage across the circuit.
Connecting wires that I will use will have a low enough resistance to have as little effect to the result as possible.
I will use the variable resistor to set a starting point on the ammeter to a point in which I will take the initial reading from the voltmeter. I will start at 0.3A and proceed in steps of 0.2A until I reach a current of 1.7A, because this will give a number of evenly space readings over the range of currents that are possible with this equipment.
The unknown resistor will be immersed in the beaker of water to keep the temperature round the resistor as constant as possible. The readings I take must be made quickly to minimise the rise in temperature. After each reading I will switch off the current, change the water and allow time for the temperature to return to the original value before starting the next reading.
The process will be repeated two more times so that I will have three voltage readings for each specified current. I will add each set of three voltages together, and then divide by 3 to arrive at an average voltage reading for each point of current.
I will store the readings I have taken in a table and then plot voltage and current on the graph.
I expect to see on the graph I make a close fit straight line going through where current and voltage are zero.
Experiment
The results of my experiment set out in a table.
To find out the resistance of the nichrome wire I will have to find the average voltage and divide it by the current.
Analysis & Conclusion
The resistance results are not exact but are very close.
The mean resistance is 5.7 therefore I believe this is the resistance of the nichrome wire.
I will plot a graph of a line of best fit.
My prediction was not exactly right although the evidence proves that Ohm’s law works the results are not perfectly accurate.
I think the reason why the results are not perfectly accurate is because of the current that is because of the current that passes through the wire gets less as the wire gets hotter which changes the readings. The water to keep the temperature of the wire and so then the thermometer reading will be incorrect.
The 3 tests of the same experiment on different currents read a similar voltage this shows that the results are quite accurate but not exact which may influence the average voltage to be different enough to make the plotted graph not to be accurate.
Evaluation
I followed out the experiment as well as I could but certain things I believe would improve the experiment in future, they would be:
- Take my results quicker so the points would be more accurate as the graph on higher current readings started to curve upwards. This is because the higher the current the quicker the temperature of the water heats up, and as the water was contained in a beaker the water heated up faster.
- To help keep the temperature of the water constant, I would find a way to put the unknown resistor in flowing water so that the heated water around the resistor may flow away to keep the temperature of the unknown resistor more constant.
Extreme anomalous points were not found although there are points that don’t go exactly on the line on graph I have drawn.