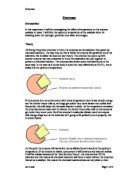
- delivery tubes x2 - 25ml measuring cylinders x2
The practical was set up like shown in the diagram above.
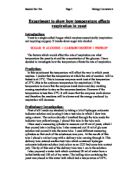
We also did a preliminary test or what is also called a practise test to see what the range of temperatures to use for the practical, we decided that the range of temperatures used would be starting either at 20*C or 30*C and since we did the preliminary test we decided that 30*C would be best because we wanted to test all the way to 70*C. the preliminary test did help us
To ensure that the practical is a fair test we would have to make things the same and have some variables and these are; the solution of yeast will stay the same, the amount and the time that we allow for the yeast to respire will stay the same and the variable will be the temperature since that is what we are testing.
And to make the experiment safe we will all wear safety spectacles.
Method
- first we gather all the equipment needed and set it up like in the diagram shown on page one
- then we prepare the solution of yeast and set the water bath to the desired temperature and have results table and other needed equipment ready
- check that every thing is set up correctly and remember safety
- begin testing – we chose to time for 15 minutes at 5 different temperatures which a are 30*C, 40*C, 50*C, 60*C and 70*C. we were originally p planning to use 20*C instead of 70*C because later after a bit off t h thinking we thought that 70*C would be better to use.
- after the practical has been finished mark results into the results table and see if there are any anomalies and confirm if you wish to do any of the temperatures again but only if there is time.
Results
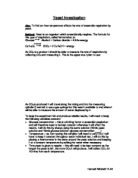
These where the results that we got from the practical.
All of these results followed a pattern apart from one which is the most of the trend by 1.5 mm3 which is at 60*C on the second test but it isn’t an extreme anomaly.
The averages are; 30*C = 5
40*C = 10.75
50*C = 15
60*C = 8.75
70*C = 2.25
My results show that at 50*C the enzymes worked best. At 30*C the enzymes respired at quite a slow rate but then at 40*C the respiration rate increased by double this is because there was more heat so more kinetic energy was gained allowing a higher rate of collisions to occur so an increase in reaction speed. At 50*C the most amount of water was displaced by carbon dioxide this follow the same reason as before accept that the molecules were moving even faster. 60*C the amount of water displaced by carbon dioxide was almost halved this is because the temperature is to high so the molecules started to denaturise which means that they start to stop working and at 70*C the amount of displaced water was even less then at 60*C, well this is because the molecules have denaturised even more and are working greatly less efficiently so few collision were occurring.
Our results show a pattern which is quite easily seen on the graph, it starts to climb at 30*C and carries on 40*C then gets to its peak water displacement which was at 50*C and then began to fall quite rapidly at 60*C right down to 70*C. at 30*C it was at 5cm3 of produced carbon dioxide and then 10.75cm3 of carbon dioxide was produced at 40*C. at 50*C at it’s peak 15cm3 then at 60*C the amount of produced carbon dioxide began to fall to 8.75cm3 and then all the way to 2.25cm3 at 70*C.
My prediction was wrong about the results. I predicted that the enzymes would collide at the highest rate at 40*C or release the most amount of carbon dioxide at 40*C but actually it was at 50*C where the highest rate of collisions must have occurred. At 40*C only 10.75cm3 was released on average and at 50*C 15cm3 of carbon dioxide was made which is quite a significant difference. My predicted results were different to the actual results this is most likely because I was referring to the enzymes in the body and they are different to the enzymes in the yeast because the body enzymes work best at 37*C but the enzymes in the yeast work best at 50*C roughly which I learnt from the practical.
My results do show a firm pattern which is shown on the graph but if I were to draw a curved graph it would have been a parabola so I drew a linear graph instead. I feel that the results were accurate as we didn’t have any anomalies and the results from both test were similar and were as far as 1cm3 off apart from one which was 1.5cm3 off so we noted that as a half anomaly but we found it as not much of an interest also the results repeated ach other as well. We as a group didn’t come to any problems and neither did I with the practical technique but there was a problem which wouldn’t have been any easy to resolve and that was then tome available basically perfect timing and organisation would have helped with that but then there was the other groups to wait for. If there any ways to improve the experiment it would be to ask for more time so we can do the experiment a few more times for more reliable result to work with and if any serious mistakes were made there would be time to recover from them. If we had more time we could also have extended the practical by maybe seeing if the strength of the solution would change the amount of carbon dioxide released and if other solution that were to be mixed in would make a difference.