During the experiment, all other aspects including placement of light source, lens, ruler should be kept constant.
Justification
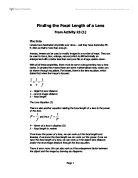
v + v = v where u = object distance
u v f v = image distance
f = focal length
v = m and v = 1 where m = magnification
u v
Therefore:
m + 1 =v
f
From diagram:
v = a + c
Therefore:
a = fm + [f - c]
c = fm + [f - a]
When this is put into a graph where the y-axis is c and the x-axis is m, using the standard formula for the equation of a graph, y = mx + c where m = gradient and c = y-intercept
Both focal length and the distance the lens lies in the tube can then be found.
Y- intercept gives focal length minus ‘a’
Gradient gives focal length.
I have chosen to conduct my experiment using this method because it is the simplest most accurate way I could calculate the values needed with the resources available to me.
It allows me to change and measure the values needed simply and accurately.
I have chosen to take the minimum and maximum values and find an average, as this will reduce the error in the measurements. If only one value for ‘c’ is taken, it could be taken again and a completely different answer could be obtained.
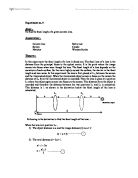
RESULTS
Experiment 1
From this and the graphs,
f = gradient = dy / dx = 0.315 / 0.0275 = 0.115m
a = gradient – y-intercept = 0.115 – 0.045 = 0.07m
Error for c = Σ errors / 7.00 = ± 0.0442
Error for m = ± 0.000500m
Experiment 2
From this information and from the graph, this gives:
f = gradient = dy / dx = 0.290 / 0.0260= 0.112 m
a = gradient – y-intercept = 0.112 – 0.0550 = 0.0570m
Error for c = Σ errors / 7.00 = ± 0.0361
Error for m = ± 0.000500m
Experiment 3
From this information and from the graph, this gives:
f = gradient = dy / dx = 0.275 / 0.250 = 0.110m
a = gradient – y-intercept = 0.110 – 0.0450 = 0.0650 m
Error for c = Σ errors / 7.00 = ± 0.0310m
Error for m = ± 0.000500m
* The original reading for this measurement was 0.112. I saw this as a possible anomaly as is was smaller than the previous reading. I took the reading again and obtained a far more accurate answer.
From the graph of the mean average answers, the final answers are as follows:
f = dy / dx = 0.330 / 0.0305 = 0.108m
a = focal length – y-intercept = 0.108 – 0.0500 = 0.0580m
I have calculated error by drawing the steepest and shallowest possible lines of best fit onto the final graph. From this, I have gained two more values for a and f as below:
Steepest: f = dy / dx = 0.330 / 0.0295 = 0.112m
a = focal length – y-intercept = 0.112 – 0.0450 = 0.0670m
Shallowest: f = dy / dx = 0.325 / 0.0315 = 0.103m
a = focal length – y-intercept = 0.103 – 0.0650 = 0.0380m
Error of focal length = (f-max - f-min) / 2 = (0.112 – 0.103) / 2 = ± 0.00450m
Error of ‘a’ = (a-max - a-min) / 2 = (0.0669 – 0.0382) / 2 = ± 0.0144m
Final Answers
f = 0.108 ± 0.00450m
a = 0.0532 ± 0.0144m
Analysis and interpretation of results
The result does support the original prediction. From checking results with others doing the same experiment with the same equipment, it was known that the focal length of the le lens to be around 0.10 m, and the distance the lens lies in the tube was around 0.05m. In my experiment, focal length was found to be 0.108 ± 0.00450m and distance from end of tube to lens was 0.0532 ± 0.0144m. The results did show that magnification was linearly proportional to distance from tube to image and this supports the fact that the equations below
1/u + 1/v = 1/f and m = u / v
are correct. I manipulated these to give:
c = fm – ( f- a) and then f and a could be calculated.
My results completely support this and using my graph, I have concluded the error for f is ±0.00450, which is ±4.02%, and the error for a, is ±0.0144 which is 26.97%. I believe the answer to f to be very accurate and reasonably reliable. The answer to a, however, though it is accurate, is not very reliable. If the experiment was to be repeated, it is not very likely that the same answer would be obtained. However, there was very little variation in the repeat readings, suggesting that the uncertainty in the results is reasonably low. For example, averages for experiment 1 and 2 for the 1st measurements of c were 0.128 and 0.120. this is a 0.8% difference which is very low.
Errors
Systematic
The systematic errors in this experiment include placement of the ruler in relation to the tube, which part of the screen the measurements were taken to, and the angle of the screen to the horizontal. If the ruler were placed slightly behind the tube, it would cause all of the measurements for ‘c’ to be too large. Equally, if the measurement to the screen was not to exactly the part of the screen that the image was focused on, then this would make the results inaccurate. If the screen were not perfectly vertical, it would enlarge or reduce the size of the image depending on the direction it is tilted.
Random
The largest and most significant random error is made in defining the focal point of the image. This error became larger as ‘c’ became larger. In some cases the points where the image could be said to be in focus were up to 0.12m apart. This was giving an error of around ±0.06m. Another random error occurs when the measurement are rounded to the nearest 0.001m. This can give an error of up to ±0.0005mm. The other random error, which can occur in this experiment, is human error.
Reducing error
I knew that the main source of error would be in the decision of where the image was actually in focus. To combat this, I decided to take minimum and maximum values for where the image could be said to be in focus. I then averaged these readings. Conducting the experiment in this way allows accurate measurements and error to be calculated easily.
When setting up the experiment, I will ensure that the ruler is placed accurately against the tube and that the screen is perfectly vertical using a spirit level.
Another way I will reduce the errors in the experiment is to do repeat readings, which will be averaged; hopefully, this will reduce the effect of any anomalies.
The experiment should be conducted all in one session, as this will reduce the likelihood of the ambient light changing and affecting the results.
An obvious two anomalies in my work are in experiment 2, with results number 3 and 4. Number three has either a too small magnification or ‘c’ was too large. Number 4 has the opposite problem. This could have been because of inaccurate readings of the measurements, changes in ambient light or a problem with the equipment used. There were no obvious discrepancies between my results and the results of others with the same lenses and so I have no reason to believe that my results are inaccurate
Improvements and further work
If the experiment were to be done again, it would have to be conducted under complete blackout conditions. Also, the light source would need to be further away and more intense so that the light rays are closer to parallel. The tube containing the lens should be moved instead of the crosshair to avoid changing the angle of the light rays when they reach the crosshair. I could also use an object, which was easier to focus to narrow down the range of values it is focused for and use a lens free from imperfections. A monochromatic light source would also make the results more accurate.
I could also do the experiment with a larger range and do more repeats.