- The thickness of the wire (SWG 32)
- Voltage setting on the power pack (5V)
- Number of wires used in the circuit to connect it all up
- Temperature of wires – I will have intervals between measurements to allow the wire to cool down from any possibility of gained heat. Also, another reason that I must try to keep the temperature constant is that resistance is also dependent on temperature, meaning that if the wire got too hot, then its own resistance would occur within the circuit due to the heat and therefore, ruin my results.
- The ruler used to measure out lengths of wires
Prediction and theory
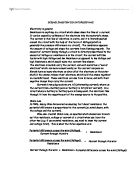
I predict that the longer the wire used in the circuit, the bigger the resistance and that the length of a wire is directly proportional to its resistance. I think this because the type of wire, its temperature, its length and its width determine the amount of resistance that a wire has and the movement of electrons through a complete circuit causes electric current. Electrons fill the space around the atoms and when they move, there is an electric current. Electricity is conducted through a conductor (wire), using these free electrons. The number of free electrons depends of the material. The current becomes resisted by the atoms in the wire and the longer the wire is the more atoms the electrons will have to get past. The electrons will obviously need to use more energy to get past the atoms because each of the atoms would be trying to keep the electrons from moving past, which is where resistance takes place.
A rough graph of what I predict will happen
Preliminary Work
In order to set the upper and lower limits of my range, I will take some measurements to work out my independent variables and to select values for the controlled variables.
Constantan Wire, SWG 32
Copper Wire, SWG 32
Nickel Chrome Wire, SWG 32
I have decided to use Nickel Chrome, SWG 32 as it seems to be the least dangerous wire to use and also provides me with the most data, because it loses heat the fastest, preventing the wire from becoming too hot too quickly and therefore interrupting the present resistance in the circuit.
Extent and Range
As I have decided that my independent variable for this investigation is the length of wire, I am going to use lengths of wires ranging from 20cm long to 100cm, as this will give me a large enough range to obtain sufficient results for my conclusion. It will be harder to go over 100cm as then two rulers will have to be put next to each other, and this is not at all reliable. The extent for my investigation would be 10 – 20cm, 30cm, 40cm, 50cm, 60cm, 70cm, 80cm, 90cm and 100cm. I will do this in order to find a regular pattern and to do a suitable extent.
I have also decided that the power pack setting will be at a constant of 5V as this is not high enough to start burning the wire but not too low that the readings will be much too small to record. Also, keeping the voltage low will help keep the temperature from rising too much.
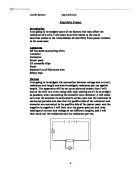
Diagram to show the circuit that I will use to investigate resistance
Procedure
- Set up the apparatus as shown above.
- Cut 100cm of nickel chrome, SWG 32.
- Tape it onto the ruler.
- Use one of the crocodile clips attached to the wire to vary how far down the wire the current flows through.
- Keeping the voltage on the power pack the same, record the volts and current present in the circuit.
- Repeat each reading 3 times.
- Record results into a results table.
- Calculate the average volts and average current flowing through at each set length.
- Calculate the average resistance using the V / I formula.
SAFETY!
- Ensure that the circuit or just the wire at least is placed on a heatproof mat, in case the wire gets too hot and starts burning the surface of the table.
- Check the circuit before turning the power on to prevent any damage to equipment or harm anyone.
- Handle wires with care to prevent cutting myself and after cutting wires, ensure no small bits of wires are left on the bench as it could injure someone.
Apparatus
- 100cm of nickel chrome wire, SWG 32
- Wooden measuring ruler (plastics ones will not do as they may melt under the heat of wires)
- Power pack
- Appropriate cables for power pack
- Ammeter
- Voltmeter
- 2 crocodile clips
- Wires for circuit
- Scissors / Wire cutters
- Source of electrical mains (plug holes) – for electricity
Section 3: Analysing and considering evidence
Mathematical Calculations
For this investigation, the only mathematical calculations that I had to do were to work out the average current and average voltage of the circuit at each length of wire from the three readings that I took at to work out the average resistance for each measurement.
To work out the average current and voltage, I added up the three (or two in some cases) readings I took for one measurement and then divided by the number of values I added together. Also, to work out the average resistance, I used the average current and voltage. Resistance is measured in Ohms and can be worked out by dividing voltage by current, i.e. resistance = voltage / current. So to work out the average resistance in the circuit at each wire length, I divided the average voltage for that circuit by the average current.
For example, at the length of 40cm, the average voltage is 1.67V and the average current is 0.21A. This means that the average resistance for a wire of 40cm would be 1.67 divided by 0.21, which gives 7.95 Ω.
An appropriate graph of my results
The graph that I have produced is on the page before, on the green squared paper.
Conclusion
My graph definitely gives a clear indication of how the resistance compares to the length of the wire as you can see a strong positive correlation. This means that when the length of the wire increases, the resistance would increase as well. This proves that the prediction that I had made at the beginning of this investigation, which was that the longer the wire used in the circuit, the bigger the resistance of current, is correct.
The graph that I have produced is very similar to my predicted graph and looking at the graph, most or nearly all of my results were extremely close to the line of best fit that I drew in, leaving no too obvious anomalous results. This meant that my experiment was quite accurate and precise.
The prediction that I made was based on some of my previous knowledge of the Ohm’s law which states that ‘the current through a metallic conductor is directly proportional to the voltage across it if other conditions remain constant’. I did the best I could to keep the other variables at a constant so that they wouldn’t affect my results too much and it seems that it worked. My results graph shows that only two of my pieces of data are anomalous, but the rest are quite near the best fit line, indicating that the results I obtained were accurate. As I have explained before, the length of the wire is directly proportional to its resistance because the longer a piece of wire is, the more atoms that the electrons will have to get past. The electrons will have to use up more energy to get past the atoms as each of the atoms are preventing the electrons from getting around them easily and freely.
Section 4: Evaluating
Anomalous results
After plotting and drawing a line graph, I could easily recognise the trend and spot a few anomalies as well. It was quite difficult to draw my line of best fit as the last 4 recordings could have sent the line in two different directions. Both have been drawn onto the graph, one in a complete straight line, one in a dotted line. However, working from the complete straight line of best fit that I drew onto my graph, I could easily see two anomalies, which were the average resistant recordings at 80 cm and 90cm. This line that I drew does hit the origin of the graph, proving that the resistance of a circuit and the length of a wire are directly proportional.
Anomalies / inaccurate pieces of data could be explained by a random error that may have caused the measurement to be read wrong, the wire starting to heat up, the crocodile clips could have been clipped further down the wire without me noticing or the free crocodile clip could have touched the wire at the wrong length, i.e. 1 or 2 milimetres off the right centimetre length.
The suitability of the procedure
I found it quite hard to ensure that the tip of the crocodile clip was exactly on the measurement that we were working on. But in general, I am pleased with how my procedure went and I believe that it was quite accurate, given that the produced graph of results was very precise with no major anomalies present. I also think that I definitely took a sufficient number of repeats, also at a large enough range, which provided me with an obvious trend to work with from the graph.
I think I could have improved the suitability of the procedure by taking great care when pinpointing exactly where the tip of the crocodile clip went to ensure precise measurements and accurate readings.
Reliability of my evidence
My results were quite accurate, as there were no major anomalies on the graph, or on the results table for that matter. There was one piece of anomalous data, but I chose to leave that out, because it was so extreme it would just corrupt the rest of my results. It was the voltage reading, at 100cm, at the 3rd and final repeat. The voltage came up as 1.07 when the previous voltages were above 2.00. So I left out 1.07 and added the two voltage readings and divided it by two for the average volts. Apart from that, I think the rest of my evidence is quite reliable.
As I had mentioned before, my best fit line on my results graph shows that there is a good strong positive correlation with the data points all very close to the line, although it was not a perfect line with all the points lying exactly on it. This shows that the reliability of my evidence and my data was very concise and sufficient enough to be recorded.
Any further work I could have done
If I had time, I could have also investigated what else affects the resistance of a current. I could have taken readings for a copper or constantan wire, both at SWG 32 just as I had for this investigation with nickel chrome. That way, I would be able to support my prediction even more with the evidence that I come up with, that this ‘prediction’ works for all metals; that all metals have a direct proportion of resistance to the length of the wire.