Light Intensity
The more intense the light, the higher the power output is. This is because when the intensity is high, more photons are emitted than would be with a lower intensity bulb. The photons also will have more energy, meaning there is a higher chance that they will knock off electrons. I will be using the same 150W light bulb throughout the experiment, keeping the light intensity constant.
Load
If the resistance of the load is too high, then the PV Cell will not be working at an optimum therefore readings will not be accurate. I will use the motor as my load, and I will not change it at all.
Orientation of PV Cell
If the PV Cell is parallel to the light source, then the maximum amount of Photons can hit the cell. If the PV Cell is at an angle then fewer photons will hit it. If it is perpendicular to the light source, all of the photons will miss and there will be no electrons knocked off. The optimum power output is when the angle of the PV Cell is 0 or 180 degrees. At 90 degrees, there is no power output. I will be keeping the angle at 180 degrees at all times, never changing it.
Surface Area
The larger the surface area, the more protons hit it, and this creates a larger power output. To increase or decrease the surface area, I could add or remove modules thus increasing or decreasing respectively. I will not change the surface area, so I will have 8 modules throughout.
Prediction
I predict that the closer the Photovoltaic Cell (PV Cell) is to the light bulb, the higher the power output will be. This is because when the PV Cell is closer to the light bulb there are more photons hitting the PV Cell each knocking off one electron. When more electrons are knocked off, there is a higher current flowing, which in turn, creates a higher power output. I also predict that the results obtained will produce an exponential curve on a graph. This is due to the fact that when the cell is very close to the light bulb the extreme amount of photons will be hitting the cell. As photons are emitted from the bulb in random directions, when the cell is moved further away it is more likely that these emitted photons will not hit the cell causing electrons to be knocked off. The reason the graph will be exponential is because of the Inverse Square Law.
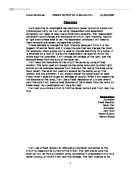
As you can see here, if A is the area of the PV Cell then all the photons travelling in that direction will hit the cell. If it is twice as far away, it will have one fourth of the photons travelling in that direction and if it is three times as far, it will have one ninth of the photons travelling in that direction. This would produce the exponential curve that should be observed by my results.
Preliminary Work
Preliminary Method
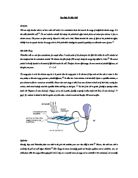
Equipment needed: PV Cell, 100W light bulb, voltmeter, ammeter, motor, ruler, protractor, retort stand with boss head and clamp and wires.
-
Set up the circuit as shown in the diagram below using a 1,5 volt voltmeter, and a 1,5 amp ammeter. Set the meters on 5 to start off with. This is to make sure they do not get damaged. If there isn’t much movement, change them down to 1. By doing this, you will be able to read the amount of volts/amps more precisely.
- Clamp the PV Cell to the retort stand so that it is at the same level as the bulb. This is to ensure that the maximum number of photons hit the cell.
-
Put the 100W bulb almost touching the PV Cell, but not quite. There is a chance the PV Cell could melt if it was touching the light bulb, because it gets extremely hot
- Turn on the light bulb and take a reading of the potential difference across the motor, and take a reading of the current through the circuit.
-
Rotate the light bulb by approximately 70 degrees and take readings for the current and the potential difference. The reason for rotating the bulb is to get a more accurate reading from it. For example, one part of the bulb may be more opaque meaning that more photons can get through.
- Rotate the bulb by another 70 degrees and take the readings again. Rotate the bulb by 70 degrees two more times, totalling 5 readings for each distance.
- Move the PV Cell so that it is 1cm from the light bulb. Take five readings of current and potential difference for each one making sure the light bulb is rotated each time.
- Do five readings every 1cm (1cm, 2cm, 3cm etc) up to 10cm always rotating the light bulb.
- Once all the readings have been taken, work out the power for each of the five readings by multiplying the potential difference by the current. Find the average power for each distance by adding up all of the powers and dividing by 5.
While doing the experiment, I realized a couple of flaws. Firstly, the fan hardly moved which indicates that the load was too high. (Too much resistance) I could either change the load, or have a more powerful bulb. I will use a 150W bulb instead of a 100W. The second problem was that the ammeter barely moved, even when it was set on 1. This is because a low current was flowing. To combat this I can use a more accurate ammeter, such as a 50, 100 micro-amps one.
Method
The method will be the same as the preliminary method, but I will use a 150W bulb instead of a 100W bulb, and I will use a 50, 100 micro amp ammeter instead of the 1, 5-amp ammeter I used in my preliminary work. Make sure when doing the experiment to do five repeat readings of each distance from the light bulb and then you can find an average power for each distance.
Variables: I am changing the distance of PV Cell from light, and by doing this I am changing the number of photons hitting the cell. I must make sure that all the other variables remain constant, otherwise the experiment will not be a fair test, and the results will not be precise.
I keep the load the same by using the same motor at all times. If I get a different motor and put it into the circuit, it’s resistance may be different and this would cause the potential difference and current to be different.
I keep the light intensity the same by using the same light bulb. I will do the experiment all in a one hour period. This is because at different times in the day and on different days, the light intensity from the sun will vary, and this will cause fluctuations in my readings. If I do it all in one go, then there is a higher chance that the light intensity from the sun will not vary, and if it does, it will not be by enough to affect the results.
I keep the orientation the same by clamping the PV Cell to a retort stand. This way, there cannot be any rotation from the PV Cell and it will always be parallel to the light bulb. If I were to accidentally rotate it a little bit, it wouldn’t be too catastrophic because the photons from the bulb are travelling in a random direction anyway, and just a slight change of angle will not really stop too many photons hitting it. There will obviously be a few less photons hitting, but not enough to worry about. If I were to move it by more than about 10 degrees then the results could be affected, but I will make sure it is parallel at all times by moving the light bulb away from the PV Cell, not the other way round. This way the PV Cell cannot be accidentally rotated.
I will keep the surface area of the PV Cell the same by using the same PV Cell throughout the experiment. If I were to use a new PV Cell, it could have a different surface area and this could mean more or less photons were to hit it, making the power output different to what it was on the other PV Cell.
Results
In column 4, I have converted the current from column 3 from mA to A by dividing it by 1000. This is just to make it easier to calculate the Power output.
I am putting my results into a graph with distance along the X-axis and Power output up the Y-axis. I will also include the error bars and try to get a line of best fit from the results.
Graph 1 shows the results with a straight-line of best fit drawn on by the computer program.
Graph 2 shows the results with an exponential curve drawn on by the computer program.
Conclusion
The highest power output was gained when the PV Cell was closest to the light bulb. The reason for this is because when the PV Cell is closest to the bulb there are more photons hitting it, knocking off electrons. This means there will be a higher current flowing and hence a higher power output.
Using the computer program, I drew on a straight line of best fit (Graph 1) and it is clear that this doesn’t fit the results well at all. The exponential curve from graph 2 fits much better through the points proving my prediction to be correct. I said the curve would be exponential because of the inverse square law (See page 3).
“The more photons, the greater the imbalance of electrons on one side of the rectifier and holes on the other, the more force with which those electrons will flow through an electrical appliance to restore the balance.”
Quote from
This quote backs up my conclusion, and proves that what I predicted is correct: When the PV Cell is closer to the light bulb there will be more photons hitting it, which means there will be a larger current and this means there will be a higher power output.
Evaluation
From my graph, it is clear that my results are not all lying on the line perfectly. They are therefore anomalous results and could have occurred due to limitations of the equipment, human error, or that conditions were not kept constant throughout. I.e., higher light intensity, different orientation of PV Cell etc.
The anomalous results on my graph are never more than 0.002W from the curve, which means that they are quite precise. The slight anomalies could be due a range of things. Throughout the experiment, people were walking past the equipment. They could have reflected some of the light from the bulb that would not normally hit the PV Cell onto it. This would increase the current and consequently the power. The light intensity from the sun could have increased or decreased during the experiment which could have caused the results to be slightly different to what they should be. The PV Cell’s orientation may have changed in the experiment and this would result in a different amount on photons hitting it than expected. Another reason could be due to inaccuracies in measuring the distance using the ruler. I could have measured too far or not far enough and this would cause the results to differ. I may also have misread the current and potential difference, which would cause the power calculation to be wrong.
I feel my method was suitable for finding results that show what is going on, but it was not accurate enough to prove my prediction exactly. The equipment I used has many limitations, and these could be responsible for various errors in my results. The actual measuring equipment is limited because it only measures to a certain degree of accuracy. The ruler I used measures in millimetres and this means there is an error value of ± 0.1cm. The effect this could have on the results would be minimal, but it would make the experiment not a fair test. If the PV Cell was 1mm too far away from the bulb less photons would be hitting it and the power would be less than expected. If it was 1mm too close, more photons would be hitting it creating a higher power than expected. The current is measured in mA and this means there is an error value of ± 2mA; and the potential difference is measured in V meaning there is an error value of ±0.02V. If I were to read the current or potential difference wrong from the multimeter, the calculation of power would be slightly wrong (because power is calculated by multiplying current by potential difference).
To improve my method, I would redo the experiment using different equipment. I would use a digital voltmeter and ammeter. This way, the reading of amps and volts would be exact, and I could calculate power far more accurately. I would also use a better PV Cell because the ones we had available are of a poor quality, and this could be responsible for anomalous results. The PV Cell I used is fine to an extent because they work in the same way as other PV Cells and they do show results that tie in with my prediction, but they are not accurate enough to prove anything for sure. I would also drape a black cloth around the light bulb and PV Cell. The reason for doing this is to stop any light from the sun affecting the results and to make sure that other people and objects do not affect the photons by reflecting them towards to PV Cell. This way, I could be certain that the only photons hitting the PV Cell were from the bulb and I could be certain that photons that are going to miss the PV Cell do actually miss it (not reflected back etc). I could also wrap a reflective material around the bulb and PV Cell, which would cause all the photons emitted from the bulb to hit the cell. The only problem with doing this is that the power output would remain constant regardless of how far the PV Cell is from the bulb. This is because photons do not lose energy when they travel through air and doing the experiment this way would defeat the issue of finding how distance affects the power output! To make sure
I feel that I took enough results to be precise enough with individual values (average of five readings) and to show an exponential curve like I had predicted. I could have measured half centimetres to make the results even more precise, but I do not think that was necessary because it is quite clear that the curve is exponential.
Safety
Never look directly at the light bulb because it is very powerful and this may damage your eyes.
Always screw the bulb in before turning it on. This is because if is dangerous to have the contacts left bare when the power is on.
Never touch the light bulb when it is on, or soon after being switched off because it gets extremely hot and it will burn you.
If using a black drape, do not let the drape touch the bulb in case it sets alight.
Bibliography
Physics 1 – Cambridge Advanced Sciences. Series Editor: David Sang
Revise AS Physics – Letts. Author : Graham Booth
http://
http://