How does the pH affect the activity of amylase
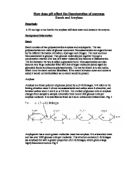
How does pH affect the activity of the Amylase?
In this investigation I am going to consider how different pH levels will affect the rate in which amylase will break down the starch molecules. I will be measuring the time it takes for a yellow brown liquid to be shown, which would show that there is no starch present in the solution because it would have been broken down by amylase in solutions under ph levels.
Hypothesis
I would expect that when the pH is increasing towards the optimum level the rate of reaction would be at the highest point but when it has reached its optimum level the rate of the activity of the enzyme would decrease.
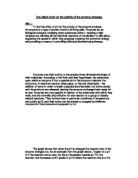
The change in pH would affect the ionisation of the side groups in the enzymes amino acid residues this would then affect the overall shape of the enzyme molecule and would then affect the efficiency of formation of enzyme-substrate complexes.
Variables
The independent variable is pH as I am adjusting the pH in each experiment, the pHs that are being used are 3, 4, and 6,8,10. With this different range of pH I hope to see what will happen to the rate of the reaction.
The dependent variable is the time it takes for the amylase to break down the starch molecules, so at the end point I hope to see a yellow solution as this would indicate that there is no starch present in the solution
The Controlled variables would be the same volume and concentration of amylase for each repeat of the experiment, same volume and concentration of starch, the same volume and concentration of iodine and the same temperature by using a water bath. This makes the experiment fair as if there was too much of one of the solutions the time taken for the experiment to work would be either longer if there was more starch solution, or quicker if there was more amylase as it would break down the starch. The buffer solution must also be kept at the same volume as the starch and amylase, but obviously the pH would be different.
Apparatus
0.5% starch Solution - this is used for the experiment as it is the substrate that the enzyme will be breaking down
0.1% Amylase solution - we need the amylase, as this is the enzyme that is used in the experiment to breakdown the starch
Water Bath at 37°C - this is used to keep the temperature constant throughout the experiment, at times the room temp can be different.
Buffer Solution - pH 3,4,6,8,10 - there are different pHs as the whole point of the experiment is to measure how the pH affects the rate of the reaction between the starch and amylase so different buffer solutions will be needed
Iodine - is the indicator so it used to test to see if there is starch present
Thermometer- this would be used to make sure the temp of the water bath is correct
5ml syringes (3) 3 syringes would be needed to take out some of the starch, amylase and buffer solution into the boiling tubes.
2 boiling tubes - this is where the reaction would take place, 1 would be for the actual experiment and the other would be for the control
Test tube stand- this would be used inside the water bath to hold the boiling tubes
200ml beaker (3) these would be used to hold the starch solution, amylase solution and also the buffer solution
Dimple Tray this where I would test the solution with iodine to see if starch is present.
Stopwatch - this would be used to time the experiment to see how long the amylase takes to breakdown the starch.
pH meter - this would be used to test the pH to see if it is accurate
Measuring cylinder- to measure out the all the solutions that are being used
Method
Before you actually do the experiment you have to make the starch solution, buffer solution and amylase solution. Firstly it is best to make the starch solution as it takes the longest to make but you can also keep it in the water bath to help it to dissolve, this can also be kept for a number of days whereas the amylase would need to be made fresh on the day you do the experiment. To make up the correct percentages you should follow this rule 0.5g with 100ml for 0.5% solution, if you were making a 1% solution then 1g would be added to 100ml of water or 2g to 200ml of water. It is always best to use distilled water when making up the enzyme ad substrate, also when doing repeats for the experiment you should also wash the boiling tubes with distilled water.
* Measure out 0.5g of starch then add it to the beaker with 5ml of distilled water stir to make a paste.
* Add 80ml of boiling distilled water and dissolve the starch within the water.
add 15ml of cold distilled water to cool the solution down, but still keep the solution in a water bath to make sure it all dissolves and also stir
* Measure out 0.1g of amylase then add it to a beaker with 100ml-distilled water and stir until the amylase has fully dissolved.
* Prepare the different buffer solutions, you should follow this table, measure each solution using a measuring cylinder then add to a beaker
pH
Na2HPO4 (cm3)
...
This is a preview of the whole essay
* Add 80ml of boiling distilled water and dissolve the starch within the water.
add 15ml of cold distilled water to cool the solution down, but still keep the solution in a water bath to make sure it all dissolves and also stir
* Measure out 0.1g of amylase then add it to a beaker with 100ml-distilled water and stir until the amylase has fully dissolved.
* Prepare the different buffer solutions, you should follow this table, measure each solution using a measuring cylinder then add to a beaker
pH
Na2HPO4 (cm3)
Citric Acid (cm3)
3
20.55
79.45
4
38.55
61.45
6
63.15
36.85
8
97.25
2.75
0
98.625
.375
* Start off by using pH 3
* Once all the solutions have been made place the 5ml of amylase and 5ml of the buffer solution into a boiling tube and then place into the water bath and leave it to acclimatise this would be the boiling with the actual experiment in.
* Also prepare 5ml of buffer solution and also 5ml of water in a boiling tube this would be the control of pH for the experiment just to compare with during the investigation
* Get 3 dimple trays and add 2 drops of iodine to each dimple
* After you have done this place 5ml of starch solution into both boiling tubes and immediately start the stop clock
* Use a pipette to take out a couple of drops of the solution and place into the dimple tray every 30 seconds and observe the colour change.
* Now wash the boiling tubes and empty out the solutions in the sink.
* Repeat this experiment 3 times
* Now change the buffer solution to pH4 then repeat steps 7-12
* Repeat this experiment 3 times
* Continue to do this experiment until you have used the 5 different buffer solutions and repeated the experiment 3 times and obtained results from all.
* Prepare a table similar to this one and check each cell until there has been a serious colour change from the colour you started with, use one column for each repeat, 3 in total
Results of the time taken for the enzyme to consume the substrate
pH level
pH 3
pH 4
pH 6
pH 8
pH10
2
3
4
Time
5
Minutes
6
7
8
9
0
1
2
3
4
5
6
7
8
9
Average
Risk assessment
Starch
Inhalation: Symptoms similar to those caused by nuisance dust; coughing, sneezing.
Ingestion: Not expected to be a health hazard.
Skin Contact: No adverse effects expected.
Eye Contact: No adverse effects expected but dust may cause mechanical irritation.
Chronic Exposure: No adverse effects expected.
Aggravation of Pre-existing Conditions: Persons with respiratory impairment may be sensitive to starch dust.
First Aid Measures
Inhalation: Remove to fresh air. Get medical attention for any breathing difficulty.
Ingestion: If large amounts were swallowed, give water to drink and get medical advice.
Skin Contact: Wash exposed area with soap and water. Get medical advice if irritation develops.
Eye Contact: Wash thoroughly with running water. Get medical advice if irritation develops.
Amylase
Avoid enzyme dust in the air
In susceptible people the repeated inhalation of dust may provoke asthma or hay fever. That is why weighing and other manipulation of the product should be carried out in a closed system. Where open handling cannot be avoided, the skin, eyes and respiratory passages should be covered for protection.
Remove spilt enzyme product at once, don't leave spilt enzyme lying around as it may form dust. Moisten immediately and remove completely. Dissolve in water before disposal
Enzymes should be dissolved in water before discharge into the sewage system. If you have been exposed to dust, plenty of tap water should be applied to the exposed areas: skin, eyes, clothing (wash as usual). If inhaled, rinse mouth and throat thoroughly, and drink plenty of water. In most cases, this treatment will prove sufficient, but you should not be careless.
Potassium Iodide
The Iodide is very toxic if swallowed
Iodine may be absorbed through the skin.
Wear safety glasses.
Wear gloves if skin contact is likely.
There are a few environmental impacts of this experiment. The enzymes must be disposed of properly as there are potential hazards which have been discussed earlier, they must be poured down the sink when the experiment is finished along with the results after they have been noted in the table.
Also all the other products such as iodine should be carefully packed away when not in use as they can become hazards when left unattended to in the lab.
Analysis
SI units were not used in this table as the number would be too large.
Table of results of the time it takes for there starch to be consumed
pH Level
pH 3
pH 4
pH 6
pH 8
pH10
+
+
+
+
+
+
+
+
+
+
+
+
+
+
+
+
+
+
+
+
+
+
+
+
+
+
+
+
+
+
+
+
+
+
+
+
+
+
+
+
+
+
+
+
+
2
+
+
+
+
+
+
+
+
+
+
+
+
+
+
+
+
+
+
+
+
+
+
+
+
+
+
+
+
+
+
Time
3
+
+
+
+
+
+
+
+
+
+
+
+
+
+
+
(Minutes)
+
+
+
+
+
+
+
+
+
+
+
+
+
+
+
4
+
+
+
+
+
+
+
+
+
+
+
+
+
+
+
+
+
+
+
+
+
+
+
+
+
+
+
+
+
+
5
+
+
+
+
+
+
+
+
+
+
+
+
+
+
+
+
+
+
+
+
+
+
+
+
+
+
+
+
+
+
6
+
+
+
+
+
+
+
+
+
+
+
+
+
+
+
+
+
+
+
+
+
+
+
+
+
+
+
7
+
+
+
+
+
+
+
+
+
+
+
+
+
+
+
+
+
+
+
+
+
+
+
+
8
+
+
+
+
+
+
+
+
+
+
+
+
+
+
+
+
+
+
+
+
+
+
+
+
9
+
+
+
+
+
+
+
+
+
+
+
+
+
+
+
+
+
+
+
+
+
+
+
+
0
+
+
+
+
+
+
+
+
+
+
+
+
+
+
+
+
+
+
+
+
+
+
+
+
1
+
+
+
+
+
+
+
+
+
+
+
+
+
+
+
+
+
+
+
+
+
+
+
+
2
+
+
+
+
+
+
+
+
+
+
+
+
+
+
+
+
+
+
+
+
+
+
+
+
3
+
+
+
+
+
+
+
+
+
+
+
+
+
+
+
+
+
+
+
+
+
4
+
+
+
+
+
+
+
+
+
+
+
+
+
+
+
+
+
+
5
+
+
+
+
+
+
+
+
+
+
+
+
+
+
+
+
+
+
6
+
+
+
+
+
+
+
+
+
+
+
+
+
+
+
+
+
+
7
+
+
+
+
+
+
+
+
+
+
+
+
+
+
+
+
8
+
+
+
+
+
+
+
+
+
+
+
+
9
+
+
+
+
+
Repeats
pH
2
3
3
9 Mins
9 Mins
8.5 Mins
4
3.5 Mins
2.5 Mins
3 Mins
6
5.5 Mins
6.5 Mins
6 Mins
8
7.5 Mins
7 Mins
7 Mins
0
9 Mins+
9 Mins+
9 Mins+
pH3
pH4
pH6
pH8
pH10
Rate (1/T)
0.052
0.052
0.054
0.074
0.08
0.076
0.18
0.15
0.16
0.057
0.058
0.058
0.052
0.052
0.052
Average Time (Mins)
8.83
3
6
7.167
9
Average rate
0.052
0.076
0.16
0.057
0.052
Table for the average and the rate of the experiment
Trends
From the 2 graphs that have been made numerous judgements can be made.
We can see that the graph showed there was a time where the enzyme was working best and generally this was in the middle of the data ranges; pHs 4, 6 and 8, but at the beginning and the end of the pH range, (pH3, pH10) it generally took a lot longer for there to be a colour change.
From the table showing the average time, we can make the assumption that at pH6 the substrate functioned most efficiently as it had the quickest time taken for the colour change from brown to yellow. We can also see that at pH3 it took an average of 18.83 minutes for there to be a colour change and at pH8 it took just over 17 minutes for there to be a colour change. From this data we can see that the optimum pH would probably be between 4 and 6 as after ph6 the time taken was quicker, telling us that the experiment was at its best at this pH. The graph seemed to be quite inconsistent as at pH 6 the time was 6 minutes for the change but the higher pH's showed very different results, with a huge difference from pH6, with pH8 having an average time of 17.2 minutes. Compared to pH 6 at 6 minutes we can see that there is a big difference of 11 minutes with pH8. Also at a lower; pH4 for example there was a time difference of 7 minutes which was another big difference. Therefore the data at pH6 could be an anomaly as the time is a lot quicker and does not seem to match the prediction graph showing an equal balance between the assumed optimum pH, or this could just be the ph at which it worked best at.
When we look at the graph showing the rate we get clearer view. We can see again at pH6 the enzyme was working best as the rate was 0.167 but again we notice the big range either side of pH6 as at ph4 the rate is 0.076 and at pH8 the rate it 0.057. Again we see that pH6 could be an anomalous result as it seems to have a much higher rate than the pH at 4 and 8. Generally we see that the enzyme has a pH at which it works best.
When we look at the graph showing the rate we get a similar view
Biological explanation
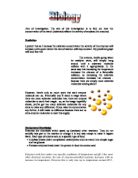
To explain this first it is good to go back to the basics and understand how the enzyme works. Amylase is a protein, and its function is determined by its complex structure in it used to break down starch molecules by hydrolysing the glycosidic bonds in starch. The reaction takes place in a small part of amylase called the active site, while the rest of the protein acts as "scaffolding". This is shown in this diagram of a molecule of the enzyme amylase, with a short length of starch being digested in its active site. The amino acids around the active site attach to the substrate molecule and hold it in position while the reaction takes place. This makes the enzyme specific for one reaction only, as other molecules won't fit into the active site. The substrate first binds to the active site of the enzyme to form an enzyme-substrate complex, then the substrate is converted into product while attached to the enzyme, and finally the product is released. This mechanism can be shown as:
The substrate molecule fits into the active site of the enzyme molecule like a key fitting into a lock. Once there, the enzyme changes shape slightly, distorting the molecule in the active site, and making it more likely to change into the product. For example if a bond in the substrate is to be broken, that bond might be stretched by the enzyme, making it more likely to break. When a substrate (or product) molecule binds, the active site changes shape and fits itself around the molecule, distorting it into forming the transition state, and so speeding up the reaction. This can be related to the data that was obtained we can see how long it took for each enzyme to consume the substrate. If we look at pH6 for example it took 6 minutes for this to happen and we could tell this as when the starch and amylase was added to the iodine, there was a gradual colour change showing how the enzyme was gradually consuming the starch and finally at 6 minutes there was no more starch left so we finally got the end point of an orange yellow solution with no starch in there.
In terms of how the pH affected this experiment we can go more in depth. Generally most enzymes have an optimum pH at which they work best. The changes in the pH of the enzyme affect the ionisation of side groups in the enzymes amino acid residues. This in turn affects the overall shape of the enzyme molecule and affects the efficiency of formation of enzyme-substrate complexes hence the difference in the range of time from 19 minutes to 5.5 minutes. We had a big change in time because the enzyme molecule gets denatured when it is not at its optimum temperature.
When looking over at my results again generally I would say that I was not surprised by my results as there was the change in which you would expect with the pH affecting the rate of the reaction.
Evaluation
Firstly when looking at the results table anomalies could be shown at pH 4 and at pH6 as the error bars are longer than those at pH, the data may not be as highly accurate as the end points were often recorded to the nearest 30 seconds, so often at the pHs of 3 for example the end point was not always 19 minutes on the dot. Also when looking at the end point for pH10 I assumed that the endpoint was 19 because it was taking too much time as 3 repeats had to be done, so this was almost an hour spent taking results on just pH10 and there was a time limit to abide by. It still looked like prediction graph as they would generally start and end at the near enough the same time. If I were to do this investigation again I would carry out the investigation fully but as this was the extreme pH value it did not make a big difference on this investigation When looking specifically into the each pH on the graph and its end point we can see that the error bars were quite small so my results were quite reliable only at pH 10 would I disagree on this I would say that the rounding up for each endpoint is not a big problem because we got a general view of the experiment and at the pH it worked best at because none of the different pH had results very similar to each other, so conclusions were still able to be drawn from this investigation. In further experiment I would try to be more accurate when measuring the data.
When using the equipment I would say that I was very accurate in making solutions for the amylase and the starch as I measured it out fairly accurate, but when making the buffer solutions I could have been more accurate as I was using a measuring cylinder and they are not as accurate as the syringes that were used to measure the starch and amylase solution, and also there was a rush to get the experiment started as it did take along time so I was not as accurate as I should have been when making the buffer solution. Since the buffer solutions needed to be accurate this could have affected some of the experiment when looking at pH generally I thought that the result times were quite high but it could have been because the buffer solution was not measured accurately. At the time there was only one pH meter available, and this had to be used by the whole class so it would have taken along time to wait for it, so at times assumptions were made that the pH was correct, so I would say that it could have affect my results although conclusions were still able to be drawn. Most of the errors made were systematic once as it was to do with measuring solutions and also making them up, there were no random errors encountered in the experiment, this was because the way I tested it every 30 seconds with iodine was done accurately to time just the endpoint was rounded up.
I am aware that this is a single piece of research done is a school laboratory so the resources that were used are not to the best standard so it was at times difficult for example when taking out samples of the solution and testing them, different measurements of the sample was taken out every 30 seconds, as it was not possible to measure it precisely each time I took out a sample. This could have affected the results that I was getting at times as it depends on noticing the colour change but when you alter the amount you get a different colour so at times again it was difficult and this again could have affected my results and my overall view of the experiment. Also since it is a school laboratory the enzyme may have been kept for a long period of time and could have been used after its declared period of activity this in turn could have had a major effect on my experiment leading to anomalous results but this is only a slight chance of this being the case and there are many other reasons as to why I achieved some anomalous results. I think that my overall experiment was conducted well in the environment that I had, it has just hard at times to put it into action perfectly so my results were affected slightly giving at times the results that were not expected for example the end point for pH8 I may have made the buffer solution slightly more acidic than it should have been as it was difficult to get precise measurements with only just a measuring cylinder so the reason why there was a longer end point could have been because the buffer solution was more acidic. If I were to do the experiment again I would use a syringe for the last few millimetres to make sure I was getting the more accurate results that I should be getting, and would also not round up the end point to the nearest 30 seconds so I would get a more accurate result. I would do this by recording the final colour change giving an exact time; I would also use the measuring equipment more accurately. I would also use a different range of pH. From this experiment I can tell that the pH that give the best results would be a low one generally from pH4 to pH7 so next time I would use pH3,4,5,6,7,8 as the pHs that I would be investigating. I would still keep to extreme pHs such as pH3 and pH10 just to show the symmetrical graph shape that should be obtained. There are a number of other experiments that I could do to investigate how starch gets affected by different factors of amylase. For example I could investigate different temperature but use the same pH as in my experiment the temperature was the same throughout; as I am sure by doing this I could have gained a better insight to how the enzyme amylase works. When you change the temperature at which the general experiment takes place you still get similar results to when you change the pH as the enzyme has an optimum temperature as well as an optimum pH but when talking about the shape of the graph curve there is a more sudden drop after you have reached the optimum temperature of the enzyme as it denatures under extreme conditions, similarly to extreme conditions of pH.