Prediction/Hypothesis:
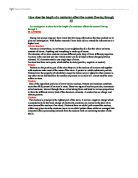
We have made V/I graphs before in previous lessons, and the line joining the plotted points together on the graph was a straight, diagonally upward, line. So my prediction is that the current and voltage will increase equally meaning the graph we produce this time will show a steady increase of both voltage and current, forming a straight diagonally upward line.
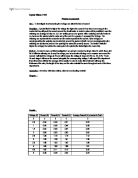
Results:
Conclusion/Analysis:
Through experimenting, I have found out about how the current increased as the voltage increased. However the rate of increase slowed down after around 3.5V – 4V. This happened because the resistance had increased. Resistance is what opposes the flow of electrons in an electric current through a conductor. Resistors are conductors that have a high resistance. A conductor is the material through which an electrical current flows.
The Resistance, of any conductor is given by the equation:
R=V/I
The electrons were gaining more and more energy from the rising voltage and atoms were beginning to collide faster and harder, with more power each time. The speed of collisions increased so much that the temperature started to rise. Increased temperature meant electrons were still getting even more energy, constantly giving them more energy. This also meant it was getting more difficult for the electrons get passed, therefore resistance increased.
The resistance is greater when the light bulb is hotter, because when any material is heated, the atoms making up that material vibrate over a larger distance more than they usually do. This vibration of atoms can get in the way of passing electrons and therefore results in fewer electrons getting through and a higher resistance. Also, the reason the filament in the light bulb heats up and glows is because the electrons passing by at a normal speed will still knock into atoms. Although it is not as frequent as at high temperatures, the electrons will cause the atom to vibrate. This is the action, which causes the heating of the filament.
Evaluation.
- Did your experiment work?
I think the experiment worked well because we tried to make everything fair by not changing any equipment through both attempts, and increasing the voltage equally at each stage.
The experiment was also extremely accurate. We read and recorded our results in milliamps (a thousandth of an amp), making them very precise.
- How good are your results?
Generally, the results we collected are really accurate. Yet there a two pairs of readings that is quite different. When the voltage was at 2.5 V and then again at 4.5V the 1st and 2nd readings have quite a difference between compared to the rest. Fortunately this does not bias the overall results (the curve on the graph) so it isn’t really that significant.
- How could you improve your experiment?
The experiment could be improved in a couple of ways, one being the amount in which the voltage was increased by. For example, the voltage would still range from 0V to 6V but instead of having 0.5V intervals you could have 0.25V. You could also do more repeat readings, so the average result was more exact.
- How could you further your investigation?
Different lamps with different voltage limits could be used. E.g. the lamp used in my experiment had a limit of 6V, instead of this you could try a 2V or 20V lamp.
You might try using a larger amount of lamps. E.g. have a circuit that included 4 or 5 lamps and seeing how this affected the resistance, if at all.
As long as it was done safely, you could try going beyond the limit of the lamp. E.g. going to 6.5V or 7V on a 6V lamp and finding out what happened then.
- Was your prediction correct?
No. I predicted a straight line on the graph. But looking at the graph and thinking about what happened during the experiment, it makes sense why the graph would show and upward curve.