- Output variable is the power given out by the solar cells.
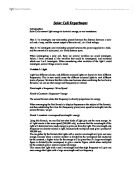
Diagram of apparatus
The circuit I used for measuring the power was set out like this. The voltmeter in parallel measuring the potential difference across the cells and the a ammeter in series measuring the current flowing through the circuit.
As you can see I have used a resistor in the circuit this is to minimise wasted energy lost by the power supply or solar cell. If the circuit did not have a resistor in the current would flow round very fast, having a large current creates more heat as speed is greater and creates large amounts of wasted heat energy, giving miss-leading results. However this was probably this would not as the current is dependant on the intensity of the light nevertheless if there was no external resistance in the voltage would read zero, as there is no potential difference across the solar cell, so calculating the power would be inaccurate.
Method
I measured the voltage produced and the current drawn by the resistor, this then gives me the power produced by the solar cells. I measured these at incremental distances from the light. For the light I used a standard desk task light that uses 60watts. I measured at 10cm increment distances from 50cm. All measurements were taken to the ±1mm tolerance using a metre ruler secured to the table with tape so it couldn’t move. After I had taken readings down to 10cm away from the light source, I then moved at 1 cm increments, as this is where I expect to get large increases in power. So I can then have an consistent number of points throughout the graph also a good range of results, as the closer you get the larger the power increases. These measurements were recorded in a table of results for inputs into a Microsoft excel spreadsheet; after this was done, the calculations can be done easily with formulas.
For each measurement, I repeated it three times and took the average the. I did this because the readings that the multi-meter gave varied by quite a wide range so I decided to take more measurements which I can then use together with previous results to find the mean to obtain more accurate view of the relationship.
To make the test fair I tried to keep variables down that could interfere with my experiment. One of these was unwanted light from the sun this I stopped by closing the blinds so that the levels of light would remain constant. I also chose to move my solar cells not my light source as this would stop the light reflecting differently as the light is moved closer to the solar cells. I also found that as I was carrying out my experiment with other people also conducting theirs. Light conditions varied as people turned lights on and off. However, the effect that this would have had on my experiment would have been minimal as all of the other sources were over 3 meters away and the intensity of the light at this distance would be minimal and not severely affect my results however, they did decrease the accuracy of my experiment.
I used 4 solar cells for this experiment instead of one as my multi-meter can measure larger values giving me more manageable numbers with more precision. This also means that if a cell giving an unusual output the others will balance this out and give a good average.
There are two anomalous results are apparent on my graphs at the time when I recorded them I realised there was a problem and took further readings and obtained the same results. I believe this was due to the solar cells not receiving their full amount of light. these anomalous results were taken at 1cm and 2cm, I believe that as they came into such a close range with the light, the shade around it prevented the light going to the edges of the solar array as it was larger than the shade causing a lower than expected power output. Due to this, I have taken the decision to removed the anomalous points from my graph as it is misleading and doesn’t improve the correlation between the set of data. Due to this I chose to adapt my procedures and extend the number of result I took before the anomalous ones to obtain a more accurate view to improve the accuracy of my work.
Safety
As the light became heated throughout the experiment, I paid attention not to touch it and not to risk placing materials that could be damaged.
Conclusion
The results that I have obtained are far from certain and have a number of limitations. They were affected by unwanted light that made the experiment less accurate also. The result is also limited by the measuring of the distance from the light as I was only 1mm accurate, also the voltmeter and the ammeter could have taken inaccurate readings throughout the experiment. Furthermore the temperature changed during the experiment when I cam in the room was 17C and by the time I finished it was 21C this is enough to cause a large change in results, this could have caused differences in the way the chemicals in the solar cells reacted as the experiment went on made the cells more or less efficient. The light also could have also changed in intensity as the experiment was carried out, at the beginning the light may have been producing a more intense light as it was cool and working more efficiently and changed as I recorded my experiment.
I found that the background light before turning the light on
I took measurements at 10 different distances and repeated them three times. To improve the accuracy I could increase the number of measurements at different distance I took. The anomalous results that I found when 1-2cm from the light also need further investigation with smaller cells that will give accurate results. The wires I used in my experiment were creating resistance and wasting energy that would not be measured this would causes problems that may increase as the experiment was carried out as the power increases as the cells produce more power and more heat generated and thus more wasted heat energy.
If I were to carry this investigation out again I would ensure that the light condition were kept at a constant level, this could be done by carrying out the experiment in a blacked out room. From my graphs I have proven my prediction of power being proportional to 1/distance2. From my graph that plots this there is a clear strong correlation between the two sets of data.
If I was to carry out this experiment again I would make sure the lamp cover dint create a shadow on the solar cell while up close by removing it leaving a bear light. I would also use a better quality solar cell as the one I used was in efficient and was inconstant in power output as temperature changed. I would also conduct the experiment in a room with a constant temperature so the experiment is more accurate. I would also use a room with only one light source and with no background light. Also I would stay in one place throughout through the experiment so my body doesn’t reflect the light differently as the experiment is carried out as it will alter the intensity of the light hitting the solar cells at different times.