These results show that my hypothesis is correct, as they are quantitative, e.g. when the load is 400g the extension is 8.5cm, and when the load is 800g the extension is 16.7 cm. I can see that the extension is almost doubled when the load is doubled which proves that my results are quantitative. Even in the pre investigation plan this show us that the extension is directly proportional to the stretching force and proves that Hooke’s Law is correct. In my pre investigation plan I also found out that the metre rule that went vertically upwards from the floor to measure the extension was 10cm higher than the desk itself. This meant that when I put my weight on the horizontal rule, the result was e.g. 12.3cm for 100g and so to get the right extension I subtracted 10 centimetres from each result.
Variables:
The manipulated variable, which I identified, will be the weight of the load. This variable will constantly change so that I can see how much the rule bends with a different mass on it each time. The results (which I shall repeat in order to create a fair test and identify any anomalies which I can later repeat) can then be recorded in a table, which can then be converted in to graphs. I hope that by repeating my readings, I can further prove that my hypothesis will hopefully be correct. Repeat readings will also enable me to work out the averages of my readings and in so doing create more accurate graphs.
The dependent variable will be the length of metre rule that hangs over the table. This shall remain constant throughout the experiment. I shall have 20cm of the rule on the table and 80cm of the rule hanging off the table. Otherwise, if we altered the load and the length of the rule hanging over the table we would not have a fair test as we could not claim that load is directly proportional to the extension because as the metre rule would hang at different lengths over the table, the extension would vary even with the same load on the rule. This would flaw the experiment, as there would be no point in investigating how extension varies with load if we could not tell due to the fact that the rule was hanging at different lengths over the table. I shall control the length of the metre rule over the table by clamping one end to a table with a G-clamp, thus knowing it can’t alter and keeping this variable the same throughout the experiment.
I identified two other variables. The first variable that I identified was the metre rule that I will use to measure the bend of the rule with the different masses on it. It is important that I always take my readings from the same height so that the same mass does not appear to bend more if I take the readings at a lower height, or less if I take my readings at a higher height. If this happened the test would be made unfair.
The second variable that I identified was the measuring rule coming in to contact with the weights being held at the end of the beam. When this happened, which it did every time I recorded a reading, the measuring rule pushed down upon the load, thus making the extension a few millimetres greater than it should have really been.
I do not think that there are any other variables to be identified because the experiment is so simple. Provided the length of the rule hanging over the table is kept constant, the mass is doubling each time it is altered so that we can tell whether it is quantitative, thus proving my hypothesis correct, and I consistently measure the bend accurately and at the same height from the ground each time, I do not believe anything else can go wrong or alter. The fact that the extension can be pushed down a few extra millimetres is a very minor variable that will not effect my investigation as a whole, but it does slightly affect the accuracy.
Method:
Here is a step-by-step description of how I will carry out each reading in my experiment:
- The metre rule will be attached to a laboratory bench with a G-Clamp.
- A loop of string will be sellotaped to the end of the rule so that the loads can be hung from the rule.
- A mass getting increasingly heavier will then be hung on to the part of the rule that will be hanging over the table.
- Another metre rule will be placed on the ground and will go vertically upwards in line with the rule that will be hanging horizontally over the desk.
- When the mass is added to the rule the bend can then be recorded as accurately as possible by the vertical rule.
- The results, which will give a suitable range by being repeated two or three times, depending on the consistency of the readings, can be put in to tables and the averages will be calculated. The anomalies will be identified and the graphs will be made.
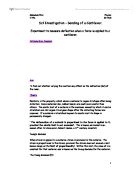
Apparatus and Diagram:
I will use the following apparatus in my experiment:
- 2 metre rules (one to hold the varied load and one to measure the extension)
- One G-Clamp (to hold the horizontal metre rule in place)
- A laboratory bench to rest the horizontal rule on
- A varying amount of loads to place on the rule (100g-1000g)
- Sellotape- to attach the string to the end of the rule
- A loop of string- upon which the varied loads are hung
This is a diagram of what my experiment will look like:
Risk assessment:
I have to take in to account the safety risks before I carry out the experiment:
- The experiment is a very simple one and any risks will be extremely minor and it just a case of using common sense to avoid any damage.
- When the load becomes heavier it becomes more unbalanced and unstable as it has a greater desire to fall to the floor, as there is a greater gravitational pull on heavy objects than there is on lighter ones. This means I must be careful not to drop the weights on to my feet, or allow them to fall on to my feet.
- Also, by adding a weight that is far too heavy for the metre rule, it is likely that the rule will snap as the elastic limit will have been broken, thus sending the weighs crashing to the floor and splinters that could end up in the body or even in the eye. But I think that this is such an unlikely event that it is unnecessary to wear safety goggles in order to protect our eyes from splinters.
- When measuring the results, my face came in to close contact with both of the rules so that I could read the most accurate extension possible for each reading. If the load fell off the rule it would flick up and hit me in the face, possibly in the eye, thus causing some potentially serious damage. Luckily, these chances are minimal and so once again it is unnecessary to wear safety goggles.
Resources from:
Physics For You - pages 114 and 74
The Internet –
Analysis:
From the evidence shown we can clearly see that as the load (N) is increased, the extension (cm) becomes greater. This is because the heavier the load, the more it wants to fall to the ground and thus the greater the extension. We can immediately see that this relates closely to my hypothesis.
The simple trend and pattern in my graph is that I have got an exceptionally good correlation between the load and the extension. My R2 value is 0.9991 and the best possible correlation is 1. This would be where the graph started at (0,0) and finished when the extension was 20cm for the load weighing 10N. Of course the graph does not continue in a diagonal line of 45 degrees forever. When the load becomes too heavy and goes past the elastic limit, otherwise called the limit of proportionality, the ruler snaps and cannot hold any more weights. In the case of a spring, it can no longer return to its original shape once it has passed the elastic limit. This means that Hooke’s Law can no longer be applied as the ‘the extension is no longer directly proportional to the stretching force.’ Once an object has passed its limit of proportionality, since it cannot return to its original shape, the extension becomes a lot greater than it ought for that particular load and subsequently no longer obeys Hooke’s Law.
From the graph we can see that when the load is zero, the extension is not zero, as I would have expected. As I had 80cm of the rule hanging off the table, and only 20cm of the rule clamped to the table it has now become apparent to me that it would have been ignorant of me to assume that there would be no extension on the rule, as gravitational pull acts upon all objects. Thus my extension when there was no load attached was an average of 1.1cm.
As the graph has a line of best fit and it appears to be a diagonal one, we can then say that the graph I have got with the results is y=ax. This shows that ‘x’ is directly proportional to ‘y’.
I conclude that up to the limit of proportionality the extension shall always increase with heavier loads, as they are directly proportional to one another. Also, the results shall be quantitative, as I have seen in my graph and from my results. This can be proved from my graph where we can see that when the load is 200g, the extension is 4.1cm, and when the load is 400g, the extension is 7.7cm. We can see that for all my results the same pattern emerges, as when the load becomes twice as great, so does the extension (roughly.) My results and my graph prove that Hooke’s Law is correct, as I have clearly seen that ‘the extension is directly proportional to the stretching force.’ This means that my conclusion supports my hypothesis entirely as I predicted all of these things that eventually happened and can now be seen in my results and my graph. I have seen that the heavier the loads, the more inclined they are to fall to the ground as they possess greater gravitational potential energy and also have more inertia (i.e. they are reluctant to move.) This can be proved by using the formula: change in gravitational potential energy (joules) = mass (kg) x g (N/Kg) x change in height (m). As ‘g’ remains constant on earth at 10N and I kept the height the same throughout the experiment, this meant that only the mass changed in order to effect the change in gravitational potential energy. Thus by increasing the load, we increased the change in gravitational potential energy.
By using Hooke’s Law and the theories behind it, not to mention gravitational potential energy, I have found out that my evidence, that is shown as a graph and a table of results, proves my entire hypothesis correct as everything that I have found out, I have also predicted. This shows that the relationship between my hypothesis and my results is very close indeed.
Evaluation:
The general trend I found agreed with that of my friends as we all found that the same patterns emerged. My results should show that as load is increased, extension is increased also and that the increase is quantitative. My results should prove that Hooke’s law is correct so that ‘extension is directly proportional to the stretching force.’ Also they should prove that the heavier loads are more inclined to bend the rule as they have more gravitational potential energy acting upon them and thus are drawn to the floor more than the lighter loads as they have a greater force of attraction. My hypothesis stated all of these things and by the use of my graph and my table of results I have managed to prove my hypothesis correct.
I repeated my readings three times, which is not a great amount, but it is enough to prove my hypothesis correct and identify any anomalies. I have found that all of my results agree with each other and do not look wrong. On my graph all the points lie on a smooth line and thus I have not identified any anomalies. This means that I have incorporated all of my results in to my final conclusion, as I have not had to leave any out. If I did have an anomaly, I would leave it out of my final conclusion as it would not fit in with the rest of my points and thus would not help to prove my hypothesis correct. I repeated the experiment three times and I have found that I got very similar results each time. The greatest difference between results for the same reading throughout the experiment was a mere 0.3cm for the extension. I am thus confident that my results are correct with the apparatus I have got and the experiment was conducted as a fair test. I think that it was a fair test as the results bear such a close relationship to one another. I think that although my results did not cover a great range, this was unnecessary as I only have one theory that I have gathered throughout the experiment and thus I am sure that it is correct. I think that if I did use a greater range of loads, I am sure that I would have ended up with the same theory that I already have.
The experiment was very simple and thus the equipment was reliable as once it was set up by hand, I could do all the work and then any minor errors in taking the readings will have been made by me, and will not be a fault in the equipment. My readings were as precise as I could make them, although I found that as I had to measure the readings on a vertical metre rule and judge them by hand, being a mere human I was prone to make some minor miscalculations in the readings. The ruler was accurate to one millimetre and I would not be surprised if all of my readings could have been half a centimetre either side of the result that I recorded. Thus on the graph you can see that there are error bars at every result shown on the graph. These show the maximum error that I could have made for each reading. We notice that they go above and below each reading as I may have measured the extension by a little too much, or a fraction too little. This is because it was relatively hard to record the readings 100% accurately. The percentage error I have calculated to be approximately 5% for each reading. To work this out I took the largest number and the smallest number, in order to find the number in the middle. This was almost 10cm. As my error is 0.5cm either side of each result I can say that to work out the error I did 0.5 divide 10 x 100 = 5%. I would have been more accurate if I used a micrometer as it gives more precise readings than a normal metre ruler. There were no other factors, other than those that I have already talked about that had to be controlled in my experiment in order to keep it a fair test provided I kept the variables the same, I would ensure the conditions of a fair test and then only my precision and accuracy of relevant readings could go minimally wrong.
The only other further work I could have done to provide additional and relevant evidence would have been to ensure that my hypothesis was proved correct by taking a greater range of evidence e.g. a greater range of masses to add to the metre rule. This would have allowed me to create more relevant and correct readings that could have gone towards backing up my hypothesis. Any anomalies would have been more easily identified and I would have created a greater range of results. Also, I could have had different amounts of the rule on the table e.g. 30cm on the table and 70cm hanging off the table. This would have enabled me to compare the repeated results to see if the same theory emerged and to prove that it was not a fluke. It would not matter that the extensions differed, provided the theory still remained the same. This was however unnecessary as I have repeated my readings enough times, so that one theory stood up above them all, to eventually prove my hypothesis thoroughly correct.
(3593 words)
Acknowledgements:
Physics For You - pages 114 and 74
The Internet –
Longman’s Student Revision Guide