I will use exactly the same equipment throughout the experiment as different wires have different diameters and length while the meters may all vary slightly.
The temperature of the pencil lead will affect the resistance. It is especially important that this remains the same as materials that are ohmic resistors, at high temperatures, can change the characteristic of the material (no longer is an ohmic resistor). The higher the temperature the higher the resistance because the electrons move faster and the positive ions vibrate more due to an increase in kinetic energy. This means that there are more collisions between them leading to an increase in the resistance. To achieve keeping the temperature of the pencil lead constant I will let the pencil lead cool for a couple of minutes after each reading as well as keeping windows closed to try and keep the room temperature constant.
- I will first of all measure the diameter (using a micrometer as this is an accurate piece of equipment) of the pencil lead and the length (using the mm ruler). I will be measuring the diameter of the pencil lead three times throughout the experiment to try and make sure that I get an accurate reading that remains constant.
- I will then setup the circuit that is displayed above. The reason why I will be using a potential divider circuit is because I can get a higher range of voltages as well as it also helps in getting the voltage more accurate. I will place the crocodile clips on the end of the pencil lead and take the width of the clips off the total length of the lead. The reason I will do this is because the crocodile clips will be conducting the electricity at the points where they are attached so the lead is only conducting past these clips.
- I will then set the voltage at a suitable start point by using the power pack to adjust the voltage but will look at the voltmeter across the pencil lead, as this is what I am measuring. I will probably use intervals of 0.1V and increase it at equal intervals using the variable resistor. At each of these voltages I will also take down the current from the ammeter.
- Once I have done enough of the different voltages, up to 2.5, I will repeat them at least three times.
- Once I have collected my results and worked out the average I will then be able to work out the resistance of the pencil lead by looking at the graphs gradient (if it is an ohmic resistor). This is because the gradient is equal to the difference in y over the difference in x. This also means that the difference in the voltage over the difference in the current equals the resistance – due to the formula R=V/I.
- Once I have worked out the resistance I can then work out the resistivity of the pencil lead by putting it into the resistivity equation (above).
This method should provide me with reliable results as I can use equipment that is quite accurate and there aren’t many factors that should affect the result if I use this method.
I will probably do up to 2.5V at intervals of 0.1V to gather a suitable number of readings. I will try to make it as accurate as possible by using an electric ammeter and a voltmeter where the intervals are 0.1V.
Preliminary Experiment
I will be carrying out a preliminary experiment so that I know exactly what I am doing and can eliminate any problems that I may come across. This will help make it a fairer test and get me used to what I am doing.
Preliminary Results
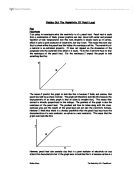
As you can see from the graph, the line of best fit does not pass through (0,0) and some of the points are quite far away from the line. This seems to be because the points seem to becoming more curved from 1V onwards. This might be because of the temperature of the lead causing it to curve or may be simply a characteristic of a pencil lead. The reason I thought that temperature might have caused this was because I noticed that the pencil lead was warm by the end of the experiment. To prevent this from happening in the real experiment I will turn the power off after every reading to cut down the amount of time current is flowing through the pencil lead causing heat. I will also let the lead cool for around a minute to try to insure that the lead does not become slightly warm. If I notice that the lead has become warmer I will leave it to cool for longer.
As the graph seemed to start curving at around 1V I decided to see what the graph looked like if I omitted all of the results passed and including 1V. This would hopefully give me a perfect straight line.
As you can see this graph shows that the results from 0V-0.8V produces a perfect straight line of best fit. This means that up to this point (possibly further if it was temperature or simply the characteristic of pencil lead effecting the results) that pencil lead is an ohmic resistor. This means that the current is directly proportional to the voltage applied to the pencil lead. The second graph shows that the resistance of this particular pencil lead is 1.798Ω (1.80Ω to three significant figures). The first thing that is immediate is that the graph is a straight line that is the characteristic of an ohmic resistor. As you can see the equation of the line is 1.7984x. This figure represents the resistance of the pencil lead. As this was only the preliminary I will not need this figure. However, if this were the real experiment I would use this figure (which is also the gradient of the line) to work out the resistivity of the pencil lead. The most important thing that the preliminary has shown me is that pencil lead constantan is an ohmic resistor (at least up to 1V). This means that current is directly proportional to the voltage. When the voltage is 0 so is the current when it 0.4 (the voltage) is 0.223 and when it is 0.8 the current is 0.443. It is not perfectly proportional due to other factors and the error made. This is important as if it was not I would not be able to read the gradient from the graph to work out the resistivity. In the real experiment I will be doing three readings of the current to make it more accurate. With these results I would then sub in the figures into the resistivity formula.
One thing I will change in the real experiment is to let the pencil lead cool down after each reading. This is because the lead became hot after current was passed through it. If I did not let the lead cool down then it would not be a fair test as temperature can alter the resistance of the material. The hotter the pencil lead the resistance increases because the free electrons and the positive ions vibrate more due to an increase in kinetic energy (the heat energy is converted into kinetic energy) so that current is reduced.
This is only a rough guide to what I would expect as the results weren’t as accurate and in the real thing I will try to eliminate other factors (such as temperature of the pencil lead). Now that I have got used to what I have to do and eliminated as many problems/factors as possible I can now start the experiment.
Significant Source Of Errors
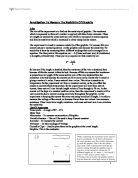
Results
*I have chosen to work out the average with three decimal places, as this will give me more accurate results.
The Graph
When drawing the line of best fit I have excluded the 1V point as I think that it is too far away from the line and would drastically change the resistance if I were to include it. The resistance of the pencil lead is the difference in y and is also the difference in x or the difference in the voltage over the difference in the current. This is because this corresponds to the formula:
Hence why is did current along the x-axis and voltage on the y-axis instead of doing a characteristic graph.
So the difference in y is 0.75-0.3225=0.5275
The difference in x is 0.84-0.36=0.48
The resistance is therefore equal to =0.65Ω. (See graph)
Now that I have all the necessary information I need to find the resistivity of the pencil lead I can now put it all into the formula:
This shows that the resistivity of this pencil lead 3.47x10⁻⁵Ωm.
Conclusion
I have established that this pencil lead is partially an ohmic resistor with a resistivity of 3.47x10⁻⁵Ωm. To work this out I had to establish the resistance of the pencil lead, which was 1.1Ω. This was worked out by using the gradient of the graph to find the resistance. It was important that it was an ohmic conductor so that I could calculate the resistance in order to find the resistivity. My graph shows that my prediction was correct; as the current was directly proportional to the voltage and the graph also shows that the pencil lead is an ohmic resistor up to about 1V. This means that when the voltage is doubled so is the current. For example: 0.4V=0.470A and 0.8V=0.917A. This is almost exact but other factors may have influenced the result such as human error etc. The typical resistivity of many semi conductors is 102 so my result is quite far away from this but the reason for this is because the typical resistivity for semiconductors is an average of all the resistivity values for semiconductors. Another reason could be the percentage error due to the equipment, which is hard to avoid as well as the external factors such as room temperature although this would not account for the difference between the typical value and my value.
When looking at my actual result and my preliminary there is quite a large difference in the results. I think that this may be because in the preliminary I did not switch off the power after every reading which lead to the pencil lead becoming warm. The resistance of the pencil lead would therefore be higher as an increase in temperature means that there will be also and increase in resistance. This is due to the positive ions vibrating more due to the extra heat energy that is transferred into kinetic energy. The electrons also have more energy so move faster meaning that there are more collisions between positive ions and electrons hence an increase in the resistivity.
Errors
The result that I have got for the resistance and the resistivity may not be accurate because of the limitations of the tools such as the voltmeter and the ruler – the intervals cause error. To account for this fact the percentage error is worked out.
I have taken the middle readings the middle reading (0.5V) where appropriate, (the ammeter and voltmeter). This is because it should be the average percentage error and is quicker than working every individual error out. The percentage errors aren’t very large with an exception to the voltmeter and there is no doubt that the errors do have some effect on the end result. The reason for the large percentage error for the voltmeter is because of the large intervals. It is also likely to be inaccurate because it was an analogue voltmeter so human error could be a cause of inaccuracy although this would not affect the percentage error. This means that I can be less accurate with my readings. The total possible error made is 21.7% so the resistivity of the pencil lead could be 3.47x10⁻⁵±21.7Ωm.
Systematic Errors
The room temperature is something that I cannot control very easily. To minimise it I will keep windows and doors closed to minimise the drafts coming into the room and trying to keep the temperature constant. The reason the room temperature has to be kept constant is because the temperature of the wire will change in accordance with the room temperature. As the temperature of the pencil lead increases so does the resistance and vice versa meaning the results become less reliable. The reason why it will be hard to control is that body heat will warm up the room as will the temperature that the wire emits etc.
The temperature of the pencil lead is hard to keep constant due to the factors explained above. However the wire will also heat up when the current is flowing through it as the resistance increases so the pencil lead will heat up as a result of the increase of resistance. To try to get the pencil lead as close to it’s original temperature by letting it to cool for a few minutes.
Evaluation
In my results there is perhaps only one real anomaly and that is the reading for 1V. However this is explainable by the characteristic of semi conductors. Other than this one there are no obvious anomalies. This is because I can make the voltage almost exact and cut down on other variables that would have affected the result. I was expecting the shape of the graph to be a straight line passing through (0,0) and then for it to start to curve from about 1V onwards. I was also expecting the resistivity of the pencil lead to be near to 10-6. The reason I was expecting this was because this figure corresponds to the average resistivity of a semi conductor, which includes carbon. My result is 10-5 but isn’t far off and could also be explained by the materials that have gone into the pencil lead as well as the percentage error. I decided to repeat the experiment three times as I thought that this would be enough results to come to a fair conclusion. It would have also enabled me to dispose of the result that were further away from the other two if the results were spread far apart – which they were not. As I repeated the experiment three times all the readings were within 0.03 of each other I think that the results are reliable. If there was one reading that had a larger gap than 0.5 between the other two I may have discarded this result to work out a fairer average. As each of the points are close to the line of best fit (apart from 1V which I have discarded) it proves that the results were reliable as there was no anomalies. The reason for no anomalies is because the voltage could be almost exact to the one that I needed. This therefore meant that there couldn’t be huge variations in the result because other variables were kept to a minimum. However, the temperature of the room may have varied from the start of the experiment to the end which would have meant the temperature of the pencil lead did not remain constant along with the fact that I may not have left the pencil lead long enough to cool could have caused a slight error in the reading.
The method that I used seemed to work quite well. I did not encounter any problems following the method. However, if I were to do it again I would leave time between each of the readings. The reason for this is because I noticed that the pencil lead became hot particularly as the voltage increased which would have affected the result of the next reading. In order to make sure that the wire would be almost as the same temperature as before would be to let the wire cool for a longer period of time. Another thing that I would consider changing would be to use a digital voltmeter instead of an analogue voltmeter. The reason behind this is because the percentage error of the voltmeter was almost 20%, which is a huge error. This could help explain why the resistivity was not 10-6. If I were to use a more accurate voltmeter the percentage error could have been cut down drastically meaning that my actual result would have been more accurate.
If I repeated the experiment I might also use a different piece of lead. The piece of lead could be of a different softness/hardness, a different diameter or a different length. I would then take one of these variables and see what happens to the resistance and then the resistivity of the lead.
Note: The actual resistivity of graphite is 7.84x10⁻⁶. There are many reasons why my result does not match up with that of the actual figure. There are three main reasons:
- The percentage error of this experiment was large and so would have probably had a huge effect on the outcome of the result. In a laboratory there would be much more accurate equipment which would have meant that the percentage error would practically be 0%.
- The actual resistivity of constantan will be in controlled conditions. This means that the pressure would have remained constant along with the temperature etc.
- The final main reason is that the pencil lead that I used does not just contain graphite. In fact it contains a variety of materials including clay. This would have a large effect on my result.
*When I measured the diameter all three readings read 2.725mm.