Prediction
I predict that the highest metal in the reactivity series and the lowest metal in the reactivity series from the metals we are using will produce the highest voltage. I think this because voltage is also called potential difference, so this shows that there is more power when the difference between the metals is larger. This means that the voltage in the metal which is lower in the reactivity series must have a higher voltage to the metal that is most reactive to make my prediction correct. I think that the highest the difference = the higher the voltage.
I also predict that changing the acid will change the ending result. I think that the stronger the acid, the higher the voltage.
I also predict that the metals that are lower in the reactivity series and closer together will have the lowest voltage.
Safety
You must wear goggles at all times because the acid might spill in your eyes and it could cause severe damage. You should be very careful with the acids and report to your teacher if any acid is spilt on the floor or a beaker breaks. You must also wash your hands if any contact is made with any of the acids.
Fair test
To make it a fair test we should use the same amount of acid for each one. The beaker should be the same height and width and so should the metals. The metals must be placed in the same position, but you might want to change it to see if it makes any difference. The same voltmeter should also be used to make it a fair test. You might want to wear gloves to make sure the metals have a clean surface.
Variables
The variables in this experiment are:
- The pairs of metals
- The acids
Results Tables
Hydrochloric acid – strong acid
Citric acid – weak acid
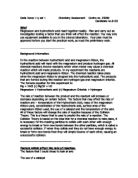
Analysis
Bar chart 1
To analyse these results you need to have a look at the reactivity series of the metals which we have used. This is shown below:
- Aluminium
- Zinc
- Iron
- Tin
- Lead
- Nickel
- Copper
This bar chart shows the results of six pairs of metals chosen at random from my result’s table, and shows the voltages of each pairs. If my prediction was right, aluminium and copper should have the highest voltage, and nickel and copper the lowest one (apart from aluminium and aluminium which were also tested).
The first time after we did our experiment, nickel and copper weren’t the lowest, but after we repeated it they gave a result of 0.03. This means we tested it wrong the first time and it gave us an anomalous result. My prediction to which two metals would give the highest voltage out of all was right, it was aluminium and copper.
The acid used was hydrochloric acid in this experiment, which is a strong acid.
Bar chart 2
This bar chart shows the results of another six different pairs of metals, tested with citric acid which is a weak acid. For the pairs that were the same as in bar char 1 (e.g. Aluminium and copper) the voltage was slightly higher but only for a 0.0 of a voltage, so this shows that changing the acid doesn’t make much difference to the voltage. To investigate this a bit further, we should have used more of the same pairs of metals with different acids, and more varied acids.
Doing this experiment twice, makes my results more reliable, and I can see that the higher the difference between the acids, the higher the voltage, as I predicted before.
There is one anomalous result in this bar chart, and that is that aluminium and aluminium got a higher voltage than nickel and copper, when there is no difference between aluminium and aluminium but there is a minimal difference between nickel and copper.
This two bar charts show that the pattern is more or less continuous, event thought it had some anomalous results which were then repeated and fitted the pattern.
Conclusion
I found out that the higher the difference between the metals, the higher the voltage.
Evaluation
I think my experiment worked and it can show you that the higher the difference between the metals in the reactivity series, the higher the voltage. My experiment, though, wasn’t very accurate as it showed quite a few anomalous results, and this wouldn’t be the best experiment to do if you wanted to find out the exact voltage of pairs of metals. If there was no other choice you would have to repeat it at least ten times, to find out the most accurate average.
The method worked, but not accurately.
This means that the method is reliable in a way that it will work to show you in rough the order of the highest pairs of metals and go down to the lowest ones. It isn’t reliable because it only gives you a rough idea of it, but if you wanted to print your results into a book or put them in the internet etc. you couldn’t say that they were reliable enough. They are reliable enough to support the conclusion.
I wouldn’t know how to improve this experiment further apart from using more accurate equipment and repeating it more times so that anomalous results fit into the pattern.
I think I got those anomalous results because the metals might have touched each other and give out the wrong voltage. It could be that I kept them in for longer or shorter than all other pairs of metals.
By Maria Guisasola, 9.1