Whenever light, in the form of photons, hits the photovoltaic cell its energy will normally be enough to release one electron, resulting in a free hole as well. If this happens close enough to the electric field, at the junction between the two types of silicon, the field will send the electron to the negative side and the hole to the positive side. This is extremely useful, as when we provide an external path for the current, the electron and hole that has just been moved will follow the path back to their original sides.
Together this flow of charge and the electric field can be used to power various objects from calculators to complete houses.
Method:
Apparatus: 12V Light Bulb Circuit Diagram:
Wires
Solar Cell
Ammeter
Voltmeter
Ruler
- Set up the circuit shown above and connect the bulb to a separate battery. Before taking any other readings, make a note of the values of the voltage and current for the background light intensity.
- Measuring from the filament, move the bulb 65cm away from the solar cell and turn it on. Make a note of these readings.
- Repeat this, moving the bulb 5cm closer each time, up to a distance of 15cm.
- This process must be repeated several times in order to get a more accurate average for the power output.
-
Work out the average voltage and current for each distance and produce values for the power at these distances using power = current x voltage.
Preliminary Experiments:
Using the above as a plan I was unable to get any reasonable results. At first I was using a standard voltmeter and ammeter for each but found that the values were too low to register. This prompted me to exchange these for millivolt and milliamp meters. These were a vast improvement. I was now able to take readings. However, the voltage and current readings were very inconsistent and were not following a pattern at all, no matter how the distance was altered.
There are several possible reasons why this could have happened. Firstly the equipment could have been faulty. To check this I replaced and tested all of the equipment but the results were still erratic. Another reason could have been that the output of the light source and the background interference was varying. This would be very difficult to correct but in conducting the main experiment I will try to make sure that the general conditions remain the same. A third possibility is the systematic variability of the solar cell. For this particular experiment this is impossible to check and if necessary correct as any error is built into the cell. As a result of these possibilities I have decided to alter the method of my experiment in several ways in order to try to correct any errors.
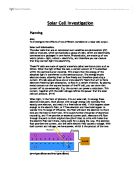
Revised Method:
To get around the problem of the sensitivities of the voltmeter, ammeter and solar cell, I have now decided to use data logging equipment. This will enable me to change the scale of the readings as well as increase the accuracy of the data as well as improving the efficiency of the data collecting process. One other change is to the light source. I will now use a 60W mains light bulb instead of the mounted 12V bulb. This will increase the power output of the solar cell, once again improving the accuracy of the results. The new method is as follows.
Apparatus: 60W Light Bulb
Solar Cell
Data Logger
Voltage and Current Adaptors
Clamp and Stand
Ruler
- Setting up the equipment in the diagram on the right, connect the adaptors to the solar cell and the data logger. In addition, the data logger must be connected to a PC running the data-logging program.
- Making sure the light bulb is switched off, start the data logger and record the background light data.
- Using the data logging programs built in data table, transfer the data to a spreadsheet program, enabling graphs of the data to be produced.
- Turn on the light bulb and repeat the above for distances between 65cm and 10cm at 5cm intervals vertically above the solar cell.
- Once again repeat the process several in order to get more accurate results when averaging.
-
Use the spreadsheet data to calculate the power output across the solar cell for each distance and trial using power = current x voltage.
Safety Analysis:
There are no major safety concerns regarding the setup of the solar cell and data logging equipment, due to the extremely small amounts of current and voltage, but there are issues relating to the light source used. It is powered via a direct connection to the mains. This is a potential hazard. One other problem could be regarding the movement of the bulb. When turned on the bulb will become very hot. I will need to be careful not to touch the glass of the bulb and should turn the bulb off before moving it.
The Data Logging Equipment:
As previously discussed, I will now use the data logging equipment available to collect the data for me. This will result in improved accuracy as well as the ability to collect more results in the same space of time.
The setup of the equipment includes the two adaptors for measuring the voltage and current, as well as a connection to a PC in order to analyse and interpret the data fed back from the data logger itself.
The computer program being used to interface between the computer and data logger is ?. < INFO ON LOGGING SOFTWARE >
< DATA LOGGER SOFTWARE SCREENSHOT >
The software itself (shown in the above screenshot) will print a graph of the results as the data is collected. I have used the data table feature to copy all of the results to a spreadsheet program (Microsoft Excel) in order to calculate the power output using a simple formula. The spreadsheet also enables me to produce my own graphs with my own variables
Results:
Using the previously discussed method, the average current and voltage was worked out from the values produced by the data logger, enabling the power output of the solar cell to be calculated.
Trial 1:
Trial 2:
Trial 3:
Trial 4:
Trial 5:
Average for all trials:
Analysis of Results:
Just by looking at the data in the table, it is easy to notice that there is a very simple trend. As the light source is moved further away the power output across the solar cell increases. This is certainly what I expected as according to the theory behind the photovoltaic effect, it is the photons of the light source that create a current through the cell. The closer the light source is to the cell the greater the intensity of photons hitting the cell. This in turn knocks more electrons off the atoms of the semiconductor, thus creating a larger movement of charge.
However it is very difficult to estimate the scale of the trend just from the results tables. For this reason I will need to produce some graphs using the previously discussed method of using a spreadsheet program. The graphs produced are of power against distance for each trial and then one for the average for the five trials.
Trial 1:
Trial 2:
Trial 3:
Trial 4:
Trial 5:
Averages:
These graphs are all very much alike and show a very similar relationship. They all show very strong trends that look quite similar to a y = 1/x graph. I will now test my results against this type of graph by plotting the distance against 1/power.
From the graph this trend is true up to the data for 40cm. Using Microsoft Excel’s built in formula generator, the equation of the straight line that fits the trend from 0 to 35cm is 1/Power = (281 x Distance) – 1794.
Using P = Power and D = Distance, the formula can be rearranged to find the power:
P = 1 / (281D – 1794)
Obviously this does not fit the data after 35cm but if I had time I would extend my investigation to include more distances in the lower region.
Error Analysis:
All of the results are very similar with the exception of the second trial. Some of the data from this trial is somewhat different to the rest. There are several reasons why this variability could have crept in.
The most likely cause is that the level of background light intensity could have changed throughout the experiment. If another light in the room had been turned on during the experiment the light intensity would have gone up. This would have resulted in an increase in current and therefore power output. Similarly, a decrease in background light intensity would have caused a drop in power output.
One other error that I have noticed is the fact that in the data for the first, fourth and fifth trials the background reading is actually higher than when the light bulb is turned on 65cm from the solar cell. This should not happen, as the intensity of the light hitting the cell would be greater when the light bulb is turned on. The reason for this is probably the same as previously discussed, that the background intensity has changed in between taking the readings.
Evaluation:
The investigation has been mostly successful, as my main aim has been completed. I have varied the distance and found that there is a relationship between the two. The general form of this trend is that the power output across the solar cell increases as the light source is brought closer. The reasons behind this have already been discussed but it was very much expected.
Generally the investigation went according to plan and there were hardly any anomalous results. The only data that looked wrong, either from the table of results or the corresponding graphs, was that from trial two. Although even then the results were so close to the others that it does not make much difference to the final outcome and the pattern produced.
Nothing went seriously wrong in the main experiments. The only difficulties came when I was doing the preliminary experiment. This enabled me to change my method in order to reduce the number of errors that were produced and also to improve the accuracy and reliability of my results. The biggest improvement to my investigation was in deciding to use the data logging equipment instead of manually taking readings off an ammeter and voltmeter. The ease of use of the data logging software made it easier to conduct the experiment in the time available. It also produced a greater amount of data enabling me to calculate more reliable averages by transferring the data to a spreadsheet program.
One possibility of further improving the method would have been to connect several solar cells together in order to increase the surface area for which the photons could strike and therefore increase the total power output. The advantage of this would have been that the data would have been easier to read and it would have been easier to notice any relationships. In addition, I could have tried the experiment in a dark room. This would reduce the intensity of the background light and would have reduced the risk of causing variability in the data, as any change in light levels would have been more noticeable.
If more time had been available and if I hadn’t made such a radical change from the preliminary method, I would have investigated further into factors affecting the power output of a solar cell. These factors could have included wavelength of the light hitting the cell, temperature of the cell and the angle at which the light hits the cell. Another variable to investigate would have been the resistance across the cell and how it changed with the distance from the light source. This would be useful, as the variable used in this investigation, the voltage, did not change much at all. Using the resistance instead would give me an opportunity to look for other relationships.
To put the experiment into a social context, this and similar investigations would help in improving the efficiency of solar cells as they would give manufacturers a better idea of which factors that they can control and which factors most affect the final power output. It would also help in determining how best to place solar panels. The most valuable investigation for this purpose would be looking at the angle at which the light hits the cell. Overall this particular investigation has been successful in that it has fulfilled its goals and has shown that there is indeed a specific relationship between distance from the light source and the power output across the solar cell.