Physics Coursework – Planning and Implementing
This investigation aims to test the relationships within the formula R= ρl/A, resistance in ohms equals resistivity in ohm metres multiplied by length divided into cross-sectional area, and to find a value for the resistivity of constanton (how strongly constanton opposes the flow of an electrical current), ρ.
I aim to find two values for ρ, one to be obtained through an experiment, and the other to be obtained using data books. By obtaining and comparing these two values, I hope to find a reliable and realistic value for constanton’s resistivity.
Plan of Investigation
Apparatus List
Just over a metre length of constanton wire, between 0.2mm and 0.4mm in diameter, to be attached using sellotape to a metre rule, calibrated in mm.
Variable resistor, 0-12Ω
Digital Ammeter, 0-10 A, +/- 0.005 A
Digital Voltmeter, 0-20 V, +/- 0.005V
Leads
Pair of crocodile clips
Micrometer
Power pack, supplying 0-2 V, direct current
The experiment - Plan
First, the metre of constanton wire must be straightened to allow it to be measured accurately. The diameter of this wire should then be measured, using the micrometer. (The zero error of the micrometer must be measured first, to ensure that the value for the diameter is as accurate as possible). Measure the diameter in three places, then compare these results. If they are not equal (to within experimental error) measure the wire’s diameter more times, to ensure a reliable value for the diameter is found. Then the wire should be attached using sellotape to the metre rule so that it is taught and without kinks, to make measurements as accurate as possible.
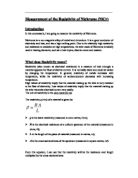
Set up the experiment as shown in the diagram. Attach one of the crocodile clips at the point marked 5cm by the rule (where its right-hand edge is at the 5cm line) and the other at the point marked 95cm (where its left-hand edge is at the 95cm line) so that 90cm of wire is in the circuit. 90 cm, rather than the whole metre, is used as the first value as the edges of the rule may be slightly rubbed off, so measurements at the very edges would not be as accurate as the taken from the centre of the rule. Now, turn the power pack on. Record the voltage and current in a table. Now, use the variable resistor to alter the voltage across and current running through the constanton wire. Record a second pair of values for the current and voltage. Use the variable resistor to change the current and voltage again, and write this down. Move the crocodile clips so that 80cm of constanton wire is in the circuit, again taking three pairs of values for voltage and current. Repeat this for 70cm, 60cm, 50cm, 40cm, 30cm, 20cm and 10cm of the wire. These values should provide a large enough range of data to, when plotted on a graph with a line of best fit to find the gradient, provide reliable results. Each length of wire should be measured in the middle of the rule rather than at one side, to avoid any systematic error in the measurement. The voltages and currents measured should not be allowed to fall below 0.1A or 0.1V, to minimise the percentage error in these variables, and to ensure any error is reasonable, rather than proportionally vast.

This is a preview of the whole essay
Peer Reviews
Here's what a star student thought of this essay
Quality of writing
Quality of writing: The quality of writing is very good. There are no significant grammatical errors. The candidate has written the coursework in a very planned and organized manner. There is a clearly labelled diagram with all the instruments used listed along with their ranges. The procedure followed is clearly stated. Overall it is very insightful and easy to understand. General notes: In order to minimize the temperature increase in the wire, the candidate has suggested using a low current, however overheating of wire would more effectively be minimized if the system is allowed to cool before each time the power pack is switched on. In a nutshell, this is an extremely good course fit even for A-level.
Level of analysis
Level of analysis and accuracy: The candidate has a very good level of analysis. He shows clear understanding as to how the data collected can be used to calculate the value of rho. The candidate shows high level of accuracy by referring to uncertainties of instruments and how to overcome them. However there is one flaw. The author has tabulated the results obtained from the experiment but he has not plotted a graph and calculated the gradient. He has also not stated the calculated value of the resistivity of constanton.
Response to question
Response to question: The candidate has responded extremely well to the question. In the beginning of the coursework he has clearly stated out what he aims to do and how he wants to do it. However he has not compared the calculated value of constanton's resistivity with the one from the data booklets like he stated he would. This piece of work, overall includes every detail need at GCSE level to perform this experiment.