The factor that I have chosen to investigate is the affect of the Concentration of the Sucrose solution on osmosis on plant tissue. This factor is important as it determines the water potential of the solution, which is a main factor in osmosis. The concentration of the solution will be my variable.
Preliminary Tests:
Before I could carry out the actual experiment I needed to conduct a series of pre-tests that would help me decide on the conditions for the experiment. Here are some of the points that I had to consider:
Importance of TIME
Do the chips need drying
Concentrations of before weighing
sucrose ?
Type of container/apparatus
Suitable length for to carry out experiment.
Chips
Pre-Test 1: Results of pre-test 1 were:
Conditions were:
-
Chips cut to 40mm
-
Volume of sucrose solution was 20cm
- Range of data collected at
- 0,0.2,0.4…1 mol
-
Chips placed in petri dish
-
Chips dried before weighing
-
10cm measuring cylinder
-
Chips kept in solution for 30 min
Pre-Test 2: Results of pre-test 2 were:
Conditions were:
-
Chips cut to 20mm
-
Volume of sucrose solution was 40cm
-
Range of data collected at 0,0.25,0.5…1mol
-
Chips placed in beaker
-
Chips not dried before weighing
- 20cm measuring cylinder
-
Chips kept in solution for 30 min
Pre-Test 3: Results of pre-test 3 were:
Conditions were:
-
Chips cut to 30mm
-
Volume of sucrose solution was 30cm
-
Range of data collected at 0,0.25,0.5…1mol
-
Chips placed in beaker
-
Chips not dried before weighing
- 30cm measuring cylinder
-
Chips kept in solution for 30 min
Pre-test 1 ~ I found that using a petri dish was difficult because it could not hold a large volume of sucrose solution therefore parts of the chips remained uncovered. Also the volume of sucrose solution was not enough to cover the chips completely and I found that with drying the chips before weighing did not show a great difference in the results that I received.
Pre-Test 2 ~ Whilst conducting this pre-test I found that the beaker allowed the chips to group together which would have affected the accuracy of the results. The size of the chips I found to be too small and difficult to handle. The volume of sucrose was just enough to cover this size chips as the beaker was a larger area. Also the 20cm measuring cylinder was not large enough to measure some amounts accurately.
Pre-test 3 ~ I found that this pre- test worked the best for this experiment. The boiling tubes allowed the chips to stay separated and the 30cm of solution covered the chips entirely. I found using the range, increasing the concentration in intervals of 0.25mol, gave me a suitable range of data and by not drying the chips gave more distinct results. The measuring cylinder was large enough to measure all the amounts of solution in the experiment. Although I did find that a longer time span was needed to get better results.
Using the information gathered from the pre-tests I decided to use the following apparatus and conditions for the actual experiment:
- 15 Boiling Tubes
- 15 uniform cut chips ~ to be cut to 30mm
- Distilled water ~ for dilutions to be made from
- 1 molar sucrose solution ~ for dilutions to be made from
- 30cm volume of dilutions
- Range of dilutions ~ 0, 0.25, 0.5, 0.75, 1 mols
- 30cm measuring cylinder
-
Electronic balance ~ to 100th of a gram
- Knife
- Tile
- Ruler
- Labels
- Cling Film
- Chips kept in sucrose solutions for 4 hours
- Chips are not dried before wieghing
Here is a table to show the measurements for how the solutions were diluted:
Method
The experiment was set up as shown below:
- First of all I took 5 boiling tubes and placed them in a tube rack.
-
The 5 uniform cut potato chips were placed on a tile and measured with a ruler to be cut to 30mm long. The chips were then weighed on the electronic balance to a 100th of a gram and the masses were recorded.
- Two measuring cylinders were used to measure the amounts of sucrose solution and water was needed for the dilutions. The different dilutions were measured and placed in the boiling tubes, starting with concentration of 0 mol then 0.25…etc
- The chips, in the order that they were weighed, was placed in a boiling tube each of 5 different concentrations.
- Each boiling tube was labelled to indicate which chips were placed in the tube and which concentration it had been placed in.
- The boiling tubes were covered with cling film to prevent an extra solution getting in.
- The experiment was repeated exactly the same two more times, to give three sets of results.
- The three sets of boiling tubes were left untouched for 4 hrs at the room temperature of the science laboratory.
- After the 4 hours had passed the chips were taken out of the solutions and their mass was weighed immediately with the electronic balance, and the length was measured with a ruler.
- All the results were recorded in a table.
Accuracy
To make sure that the experiment was carried out as accurately as possible I:
-
Used an electronic balance, which was correct to a 100th of a gram.
- Measured the chips with a ruler instead of graph paper that became soggy when in contact with water.
- Used a 30cm measuring cylinder so I could measure the dilutions in one go.
- Used labels so I could keep track of which chips were placed in which concentrations.
- The experiment was carried out 3 times so an average could be taken and the chances of getting anomalous results would be reduced.
Fair Test
The experiment I conducted was a fair test because all the following conditions that the chip was placed in remained the same throughout all the experiments:
- Boiling Tubes
- Uniform cut chips ~ to be cut to 30mm
- 1 molar sucrose solution used for dilutions to be made from
- 30cm volume of dilutions
- Range of dilutions were 0, 0.25, 0.5, 0.75, 1 mols
- 30cm measuring cylinder
-
Electronic balance used to 100th of a gram
- Time chips were kept in solution
Safety precautions
Whilst doing this experiment I will need to consider safety precautions such as:
- Wearing a lab coat and safety goggles whilst conducting the experiment that involves solutions.
- Take care when using a sharp knife to cut the chips.
- Remember to clean up any spilt solutions immediately to avoid accidents
- Take care in handling many boiling tubes and if one was to break clear up broken glass quickly with care.
Predictions
In theory I predict that the chips which are placed in dilutions from the one extreme, 0 mol concentration of sucrose onwards, will increase in mass and length until a certain point. I predict this because the cytoplasm of the potato (plant) cells and the cell SAP from the vacuoles contain salts sugars and proteins that reduce the concentration of free water molecules inside the cell. This means that the water potential inside the cell is low.
The theory and textbooks say that Osmosis is the movement of water molecules from a high water potential (concentration) to a lower water potential (concentration) down a concentration gradient.
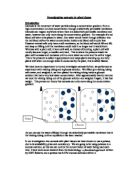
Relating this to the experiment would mean that, at 0 mol concentration of sucrose solution the chip is placed in would be all distilled water and therefore have many free water molecules. The theory suggests that if the potato cell is surrounded by a solution more dilute than its content, water will pass into the vacuole by osmosis. This would mean that the net movement would be, high concentration of free water molecules in the distilled water would move to the low concentration of water in the potato cell vacuoles. This can be shown in the diagram below:
As water molecules enter the vacuole of the potato cells by osmosis the vacuole will expand and press outwards onto the cytoplasm and cell wall. A cell that is experiencing this is said to be turgid as the vacuole is exerting turgor pressure on the cell wall. This would be occurring in all of the potato cells causing the chip to expand in mass and length.
From the extreme of 0 mol concentration, the net movement of osmosis as explained before is going to decrease, as the concentration of sucrose solution is increased.
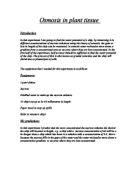
There will come a point where the concentration of the sucrose solution has a lower concentration of free water molecules than inside the plant cell. From this point of concentration of sucrose I predict the chips will decrease in mass and length. The theory suggests that if the plant cell is surrounded by a solution more concentrated than its content, water will pass out of the vacuole by osmosis. This would mean that the net movement would be the higher concentration of free water molecules in the potato cell vacuole would move out to the low concentration of water molecules in the sucrose solutions. This can be shown in the diagram below:
As water molecules move out of the vacuole the potato cells the potato cells lose their turgor pressure and become flaccid. A potato chip with flaccid cells will be limp as the vacuoles of the cells become smaller, therefore the chips would decrease in mass and length.
In an extreme case, which may be reached in this experiment, if the plant is placed in a solution with a very low water potential, the vacuole may loose so many water molecules moving to the low potential area that the cytoplasm and vacuole pulls away from the cell wall. The cells are said to be plasmolysed.
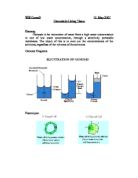
I predict that the graphs for this experiment should follow a general trend shown below where 0 mol of sucrose concentration will the highest point for largest increasing change in length and mass and 1 mol concentration will be the lowest point for largest decreasing change in mass and length.
Turgor pressure
Change in
Mass or Sucrose
Length Concentration
Becomes flaccid
I carried out the experiment and the results are found on the following pages.