- The colorimeter readings may have been above the actual value for each reading.
- The 1% trypsin solution may not have been exactly 1%, creating an error in all of the readings.
- There was a delay in starting the stopwatch and taking out the mixture from the boiling tube into the cuvette, causing a potential error in the reading. In this case, the reading would have been higher than expected.
Random errors (values equally likely to lie above or below the true value) –
- The reaction ratio between the trypsin solutions and milk powder may not have been exactly 1:1.
Risk Assessment –
There are no major risk factors in this experiment. Pupils should be warned against drinking the milk powder solution. Glassware should be handled with care and pupils should operate the colorimeters in a professional manner.
Variables –
The amount of milk powder was kept constant throughout the experiment to keep the amount of substrate the same.
Independent variable: volume of trypsin solution
Dependent variable: colour absorbency
Results –
Conclusion –
- From the graph, we can see that all rates of reaction follow a sigmoid curve (S shaped curve). The rate of reaction starts of slowly, before gradually increasing. It then decreases after the midpoint of the reaction, eventually levelling off. I did not have sufficient time to obtain the time taken for the 0.25% trypsin solution to reach 100% clearness.
- My hypothesis proved correct. The 1% trypsin solution did indeed have the fastest rate of reaction, reaching 100% clearness at around 7 minutes. The 0.5% solution had only a 64% reading at 7 minutes, reaching 100% at around 9.5 minutes.
Discussion –
A higher concentration means a higher number of enzymes in a fixed volume, therefore having a higher number of reactions in a given time (more active sites). Theoretically, in the experiment, the 1% trypsin solution should have contained twice the amount of trypsin than the 0.5% solution. The higher number of active sites meant that the 1% trypsin solution should have happened at double the rate of the 0.5% solution, due to the fact that there was twice the amount of trypsin reacting with the milk powder in a given time. The mixture clears up (100%) because all of the milk powder reacts with the trypsin eventually.
Experiment 2:
Hypothesis –
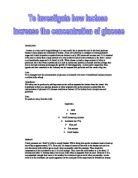
My hypothesis for this experiment is that the more potato slices placed in the hydrogen peroxide, the faster the rate of reaction between the catalase and hydrogen peroxide, hence the more gas produced in a given amount of time.
Apparatus –
- Stopclock
- Gas syringe
- Measuring cylinder
- Hydrogen peroxide
- Retort stand and clamp
- Stopper
- Potato
- One potato
- One size 4 cork borer
- 5 conical flasks
- Knife
- Ruler
- White Tile
Fig. 1
Method –
- Using the cork 4 borer, cut out 5 strips of potato.
- Cut off the ends of each potato slice containing the skin.
- Using a ruler and a knife cut the potato slices into thirty 1 cm pieces.
-
Measure out 15 cm3 of hydrogen peroxide solution and pour it into a conical flask.
- Set up the apparatus as shown in Fig. 1. Remember to remove all the air from the gas syringe.
- Take out 2 slices of the 1 cm potato pieces and place them into the flask containing the hydrogen peroxide.
- Start the stopwatch and record the gas produced every 30 seconds for 5 minutes. Record all the data onto a table.
- Repeat steps 4 to 7 but using 4, 6, 8, and 10 pieces of potato each time, recording all the results.
Potential errors in readings –
Systematic errors (values differing from the true value by the same amount) – any errors caused by the method is a systematic error as repeats will not improve the reliability of the results.
- There would have been a time delay between putting in the potato slices and starting the stopwatch (human error).
- Some gas may have escaped from the conical flask, causing a lower reading (experimental error).
Random errors (values equally likely to lie above or below the true value) –
-
The hydrogen peroxide solution may not have been exactly 15 cm3, thus creating a different amount of substrate.
- The gas syringe could not be fully emptied of all the air. This may have caused a higher reading.
- The potato slices did not have the same surface area, causing an irregularity in the results.
Variables –
The amount of the substrate (volume of hydrogen peroxide) was kept constant throughout the experiment.
Independent variable: pieces of potato
Dependent variable: volume of gas produced
Risk Assessment –
Hydrogen peroxide should be handled with gloves and eye protection equipment. Care should be taken when handling the cork borer and knife. Gas syringes should be handled carefully.
Results –
Conclusion:
From the table and graph, we can see that my hypothesis proved correct. The conical flask containing 10 slices released gas at a faster rate and also at a larger amount. From the graph, we can see that the lowest rate of reaction was the flask containing 2 slices. The order then went from 4, 6, 8, and then to 10 slices. My results were quite good because looking at the graph, the amount of gas produced every 30 seconds in the conical flask containing 4 slices of potato was almost exactly double the conical flask containing 2 slices. This trend was also seen between the conical flasks containing 4 and 8 pieces of potato.
Discussion –
The increase in potato pieces meant an increase in surface area, and also the increase in the number of catalase enzymes. Due to the fact that the amount of substrate didn’t change (hydrogen peroxide), an increase in catalase caused an increase in the rate of reaction due to more actives sites, causing more gas to be produced.