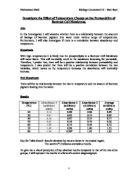
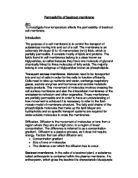
The asterix (*) indicates anomalous results.
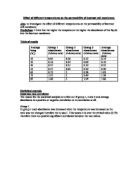
To give me a visual perception of my obtained results compared to that of the two other groups, I will represent the results in a form of a scatter diagram/graph.
I will use the Spearman Rank Statistical test to carry out a statistical analysis of my results. This will allow me to establish a significant relationship between the two sets of data, which are the temperature and the absorbency.
To work out the significant relationship I will be using the following formula:
Rѕ = 1 – 6 ∑D²
n (n² - 1)
Rѕ = 1 – 6 x 2
n (n² - 1)
Rѕ = 1 – 6 x 2
7 (7² - 1)
Rѕ = 1 – 12
336
Rѕ = 0.96
I have been provided with a table, which indicates that for every ‘n’ value there is a critical value. For 7 pairs of measurements the critical value is 0.79. If Rѕ is greater than or equal to the critical value indicated in the table, than there is a significant relationship between my sets of data.
Rs = 0.96 > 0.79. This indicates that there is a correlation between temperature and the absorbency. I also know that I have a positive correlation, as 0.96 is a positive value.
I also need to work carry out a Spearman’s rank test using my average value of absorbency, which includes my own set of results as well as the two other pooled results.
Rѕ = 1 – 6 ∑D²
n (n² - 1)
Rѕ = 1 – 6 x 2
n (n² - 1)
Rѕ = 1 – 6 x 2
7 (7² - 1)
Rѕ = 1 – 12
336
Rѕ = 0.96
Rs from my average value of absorbency is identical to the previous Rs. This clearly means that I have successfully managed to support the fact that there is a positive correlation between absorbency and temperature. Therefore, I can discard my Null Hypothesis, which states otherwise.
The first graph, which is a scatter diagram of pool results, displays my results alongside with two other students. By carefully comparing the graph I have noticed that all the results indicate the same pattern of a positive correlation. However, I have noticed that one set of results had produced an anomalies result. Therefore, I intend to discuss possible limitation and problems, which may have caused this. The graph as well as the statistical analysis both indicates that my prediction was correct, and as a result of this I can discard my null hypothesis.
Scientific Knowledge
In the cells of a beetroot plant, substances called anthocyanin, which are common plant pigments, is contained within the plasma membrane. Anthocyanin is water-soluble glycosides with some or all of the sugar groups removed. The red/purple characteristics of a beetroot plant are produced from the anthocyanin, which in turn contains a positive charge distributed over the chemical ring system. A damaged beetroot cell with a broken membrane would initiate the anthocyanin bleeding out of the cell like a dye. This aspect could be used to test the conditions that affect the integrity of the cell membrane.
The cell membrane in a beetroot plant is made up of a phospholipid bi-layer, which forms a fluid mosaic structure. If the temperature were increased the cell membrane would gain high kinetic energy and vibrate vigorously, causing the phospholipid bi-layer to break, which in turn would increase the size of the pores. Consequently, if temperature continued to increase then undoubtedly the plasma membrane of the beetroot cell would rupture. This due to the fact that the phospholipid bi-layer, which forms the cell membrane, is made of proteins, and as the kinetic theory states; with increased temperature molecules in the protein will receive high energy and vibrate vigorously. For that reason, above the optimum temperature, the bonds holding the protein structure together will be broken, thus the proteins are denatured. This means at higher temperatures more of the pigment or anthocyanin would leak out, in turn increasing the rate of diffusion. Therefore in this investigation I have decided to investigate the temperature variable and use the colour change, caused by the anthocyanin as the independent variable. The results, which I received, seem to support this fact, in that as the temperature increased the percentage transmission of light read by the colorimeter decreased.
Evaluation of Evidence
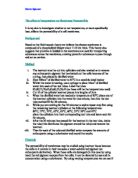
The graph produced from my results seem to illustrate the same trend as the two pooled results, which is that there is a direct proportionality between the increase in temperature and the absorbance. This indicates that my results were somewhat reliable. Throughout the experiment I used a syringe for measuring volume, which consequently would have increased precision, as this assured the measurements used were to the nearest millimetre. Moreover, I also used a stopwatch, which ensured that the time in which I allowed each set of beetroot discs to be heated in water was kept constant. I also used the same cork borer to cut out each beetroot cylinder, which indicates that all the beetroot cylinder should have been more or less identical to each other.