Now, I will explain my method of measurement. The idea behind the experiment is very simple; to add masses of 50g and 100g to an electromagnet at a certain current (in Amps) and record the mass that the electromagnet could hold and then to draw a graph of mass against current and analyse its shape. To keep the experiment as fair as possible, I measured the current every 0.2A from a range of 0A-3.4A (giving 18 readings). However, as the variable resistor was very sensitive, I may have had a measurement error in the range of ±0.05A. However, to maximise the reliability of this experiment, I performed the experiment 3 times and then used the average of my results to plot my graph. This minimised the error range. Furthermore, the hook that held the weights to the electromagnet weighed 23g. In order to maximise efficiency, I used the mass of the hook as a weight measurement, too. Each load of 50g or 100g also had the mass of the hook added to it, to maximise reliability of the results.
Finally, I shall give my hypothesis. I predict that the graph of mass against current will be an S-shaped curve. I think this because at the start of the experiment, the magnetic domains in the piece of magnetically soft iron will be randomly arranged, with only a few arranged in the correct way, creating a flat, small gradient to the graph. This means that the electromagnetic field will be very weak, enabling the electromagnet to pick up small loads of mass. However, as the current increases, more and more domains will be lined up, increasing the mass that the electromagnet will be able to lift, and causing the gradient of the graph to initially increase each time a new mass is put on and then to decrease as the majority of the domains are lined up, thus creating a curve. However, at a certain point, the domains will all be lined up. At this point, the electromagnet cannot carry any more mass, no matter how much more current I put through the solenoid as it is completely magnetised. This will form an S-shaped curve.
However, if I do not reach the part of the graph where the points level off (if there is not enough current to line most of the domains up), then I will only plot the first part of the S-shape, corresponding to an x2 graph (a parabola of a quadratic equation).
As a summary, I believe that as the current increases, more mass will be picked up by the electromagnet, forming an S-shaped curve.
2. EXPERIMENT:
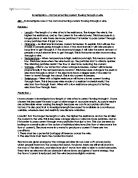
Results Table:
In this results table there may be errors due to the presence of anomalous results. In order to get the best results, I have estimated that in my measurements of current there was, on average, an error of 0.05A either side of each measurement. There was also an average error of 50g in my measurements of mass as I only used 50g and 100g weights. Hence, there is an error of 50g either side of my mass measurement. I plotted these error bars on my graph, to make it fairer.
3. ANALYSIS:
I have observed the following by plotting my graph. The graph is the parabola of an x2 graph (a quadratic equation). This is exactly what I expected from my hypothesis. However, I also predicted that the full graph would be an S-shaped curve. The graph showing my results only shows the first part of the S-shaped curve because the current was not high enough to line up all the magnetic domains up to completely magnetise the magnetically soft iron core. For this to happen a much higher current than 3.4A used in this experiment would be required.
The graph had an equation of:
Y = 109.82x2 + 27.128x + 5.4561
This confirms that the line was a parabola of a quadratic equation (of formation ax2+bx+c) where a=109.82, b=27.128 and c=5.4561 (the y-intercept).
To further justify that this line was the best correlation to the data, it had an R2 value of:
R2 = 0.9849
As a perfect correlation is when R2=1, I only had an error of 0.0151. This indicates that the regression line is almost perfect. This in turn confirms that the line is a parabola, proving my hypothesis to be correct.
I only had 3 minor outliers:
(2.4,673) , (2.8,839.7) , (3.2,1373)
These anomalies are naturally occurring variations. I can tell this because all of them occur within the last 5 values and in the rest of the graph there are no anomalous values. The reason for this is that, as more domains line up in the iron core, the more range there is for an error, magnifying the error potential, and causing these values to become less aligned and more irregular. I believe that if I would have continued recording the results up to the area where the graph becomes S-shaped, then there would be even more anomalies.
4. EVALUATION:
I believe that this experiment was effective, as I have taken into account all the factors that prevented it from being an unreliable experiment, making it as fair as possible. The above statement is supported by the fact that my values have very small variations showing that each of my 3 experiments were performed under almost identical conditions. Also, further evidence of the experiment being effective was that there were only 3 outliers in my 18 results. This shows a very small proportion of anomalous results.
However, the fairness of the experiment is outweighed by its inefficiency. The experiment may have been made unfair by 3 main factors; the equipment I used, the number of measurements of current and mass (and whether I repeated them enough times) and the error in my measurements of mass.
The first factor that may have made my results unfair was the fact that I used normal laboratory equipment that was not of maximum efficiency. This may have affected my results.
The second factor, which may have affected the outcome of the experiment, was the number of measurements of current and mass. I measured current at intervals of 0.2A. To improve my results table and graph, it may have been better to measure the current at intervals of 0.1A as this creates a smaller range for errors to take place, keeping the results more equal and evening out any bad results. However, I consider that I repeated the experiment enough times, as an average of 3 times is very fair. However, if I would have repeated it some more times (e.g. 5 times) then it may have given me a smaller error range, as the big errors may have evened out by the number of times I repeated the experiment.
The third factor, which may have affected my results, was the error in my measurements of mass. The masses I used (excluding the mass of the hook, attached to the electromagnet to hold the masses) were either 100g masses or 50g masses. This meant that the error in measurement was 50g. This made the test unfair, creating possible anomalous results. However, I tried to keep the graph as fair as possible by creating error bars on the graph to account for this factor.
Finally, I could make a few improvements to this experiment, to make it even fairer. Firstly, I could perhaps record my current every 0.1A rather than 0.2A as this helps to make the experiment fairer with a smaller error range.
I could also repeat the experiment 5 or 6 times to iron out any outliers and keep the results as compact as possible, with an almost perfect correlation for the graph.
Lastly, instead of using masses of 50g, I could use masses of 10g. This would help to reduce the size of the error bars shown on my graph.