Enzymes are very sensitive to changes in temperature. When you look at a graph of temperature against enzyme activity, between 0oC and 37oC, the enzyme activity goes from 0 to a maximum level, so 37oC is called the optimum temperature for enzymes. Scientists call the relationship in this area Q10=2, this means that if you increase the temperature by 10oC, the reaction rate will double e.g. if catalase gave off 5cm3 of oxygen per minute at 10oC, then it would give off 10cm3 of oxygen per minute at 20oC. This is because when the temperature goes up, the enzymes and substrates are moving around a lot faster, so they bump into each other more often making more product. Between 37oC and 65oC, the enzyme activity goes from its maximum level back down to 0, this is because anything that breaks up the tertiary structure of a protein will have the same effect on an enzyme. Tertiary structure is held together by very weak bonds like hydrophobic bonds, hydrogen bonds and ionic bonds. When the temperature goes high, molecules are moving around so fast that they keep hitting the enzyme too hard, which breaks these weak bonds. Because the enzyme structure has been destroyed, its active site can’t work anymore so no more products can be formed.
Enzymes are also very sensitive to changes in pH. If you look at a graph of pH against enzyme activity, the graph is at its maximum at pH 7 but it falls very sharply down to zero when you lower the pH to fairly acid values or when you increase the pH to fairly alkaline values. This is again because tertiary structure is held together by very weak bonds like hydrophobic bonds, hydrogen bonds and ionic bonds. Acidic and alkaline pH values break these weak bonds. Because the enzyme structure has been destroyed, its active site can’t work anymore so no more products can be formed.
Sources of information
Biology 1 by M Jones, R Fosbery and D Taylor.
Advanced Biology by C Clegg and D Mackean.
Revise from Diagrams Biology by W Pickering.
Prediction
My prediction for this experiment is that my graph of pH against reaction rate will be at its maximum at pH, but will fall very sharply down to low values when I lower the pH to 3 or when I increase the pH to 11. This is again because tertiary structure is held together by very weak bonds like hydrophobic bonds, hydrogen bonds and ionic bonds. Acidic and alkaline pH values break these weak bonds. Because the enzyme structure has been destroyed, its active site can’t work anymore so no more products can be formed.
Fair testing and my Preliminary experiment
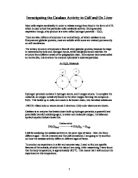
In this experiment I am going to be investigating the effect of pH on the reaction rate of catalase. The only thing I will change will be the pH, everything else I will keep the same. I will use the same concentration of hydrogen peroxide in all my experiments, the same volume of hydrogen peroxide and the same volume of pH buffer. I will also always use the same starting volume of carrot.
I did a preliminary experiment to get a general feel for how to use the apparatus. I tested four different types of plant material. These were radish, potato, spring onion and carrot. The table I have made below shows the time taken for the discs to rise to the surface.
The table shows that the plant extract that caused the fastest rise was carrot. This means the rate with carrot solution is the highest and so it means that carrot extract has the highest catalase activity of any of the plant materials used. I used this to make my plan because I decided in my main experiment to use carrot because it is the plant material with the highest catalase activity of any of the plant materials used.
In my preliminary experiment I only added 0.5ml of buffer to the carrot paste. This made it difficult for the carrot to settle properly, so this also helped my plan because in my main experiment I added 2ml buffer so that the carrot could settle properly.
Risk assessment
Equipment list
Method
- I took a white tile and cut the outer skin of the carrot using a knife.
-
I used a razor blade to cut the piece of carrot into a cube with sides of 1×1×1 cm3 with the help of a ruler.
- I put the radish piece into a mortar and added a small pinch of sand. I pounded the carrot and then ground it up.
- I added 2 ml of pH buffer to the ground carrot. Depending on the experiment I was doing the pH of the buffer was 4, 6, 7, 8 or 10.
- I scraped the carrot paste and solution into a plastic PONY vial and pushed the solid material down using a spatula.
- I labelled the PONY vial, put the lid on tightly and shook the PONY vial.
- I left the PONY vial for 5 minutes to allow the contents to settle.
- Using the forceps I dipped a filter paper disc into the solution part of the carrot extract and blotted it on a sheet of filter paper.
- I filled a glass well almost to the top with hydrogen peroxide solution.
- I dropped the disc into the solution and timed how long it took for the disc to go from the bottom of the solution to the top using a stopwatch.
- I repeated each experiment 4 times for each different pH level.
Table of results for catalase activity at different pHs for carrot
Graph
Analysing
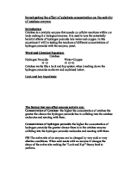
My graph shows a pattern that is virtually the same as my prediction. At pH 1.5 the average rate is 0.000s-1. By pH 4 the average rate has gone up to 0.017s-1. The rate then goes up to 0.046s-1 at pH 6 and the maximum rate is reached at pH 7, when the average rate is 0.068 s-1. This is the optimum pH for catalase, just like I said in my prediction. After that, at pH 8, the average rate falls to 0.045s-1, then falls to 0.015s-1 at pH 10 and falls to 0.000s-1 at pH 12.5. The shape of the graph is basically the same as it is in figure 3.9 on page 48 of Biology 1. I used this graph to make up my prediction. There is an important difference, which is that even though the optimum pH in Biology 1 is 7, the rate of reaction falls down to zero at pH 3 and pH 11. These values when the enzyme rate goes to zero are different to my results, due to errors in my experiment which I talk about in my evaluating section. These errors also meant that the amount of accuracy in the way I measured my results meant that I could only write down my results to a level of accuracy of 2 significant figures.
Why did the average rate go down from 0.068 s-1 to 0.017s-1 when the pH fell from 7 to 4? Because enzymes are very sensitive to changes in pH. If you look at any graph of pH against enzyme activity, the graph is at its maximum at pH 7 but it falls very sharply down to zero when you lower the pH to fairly acid values. This is because tertiary structure is held together by very weak bonds like hydrophobic bonds, hydrogen bonds and ionic bonds. Acidic pH values break these weak bonds. Because the enzyme structure has been destroyed, its active site can’t work anymore so no more products can be formed.
Why did the average rate go down from 0.068 s-1 to 0.015s-1 when the pH went up from 7 to 10? Because enzymes are very sensitive to changes in pH. If you look at any graph of pH against enzyme activity, the graph is at its maximum at pH 7 but it falls very sharply down to zero when you raise the pH to fairly alkaline values. This is because tertiary structure is held together by very weak bonds like hydrophobic bonds, hydrogen bonds and ionic bonds. Alkaline pH values break these weak bonds. Because the enzyme structure has been destroyed, its active site can’t work anymore so no more products can be formed.
Evaluating
When I did my preliminary experiment, I got an average rate for carrot with a pH 7 buffer of 0.14 s-1. Then, in my main experiment with carrot at pH 7, I got an average rate of 0.068 s-1 which is twice as much when it should be the same. This is because using plant material is an inaccurate way of getting a precise amount of catalase. I am going to talk about why this is but before I do that I need to show the effect this had on my results.
When the pH was 4 my results were 0.017s-1, 0.015s-1, 0.017s-1, 0.018s-1. These results are similar to each other and this shows up on my graph as a small error bar line, so this set of results is very reliable. At pH 10 the results are even more reliable. When the pH is 6 or 8, the error bars go longer showing that the results are more different and less reliable. At pH 6, my results are 0.056s-1, 0.040s-1, 0.042s-1 and 0.046s-1. From looking at the graph I have labeled the 0.056 s-1 as an anomalous result because it is much higher than any of the other results. At pH 8, my results are 0.050s-1, 0.044s-1, 0.038s-1 and 0.046s-1. From looking at the graph I have labeled the 0.038 s-1 as an anomalous result because it is much lower than any of other results. Now I need to talk about why I got all these anomalous results. My experiment was not as reliable as it might have been because there were a lot of experimental errors, and I have to say what these errors are in order of how important they are.
My main source of experimental error: I got my results in two different practical sessions done a week away from each other. This means that I used two different samples from two completely different packets of carrots. Carrots that come from different farms are going to have different amounts of catalase in them, so this means that the test isn’t really fair because the variable of enzyme concentration is going to change slightly, and it is supposed to be kept the same. So to improve the reliability of this experiment it would be better to do one longer practical session using the same piece of carrot for all the results.
My 2nd main source of experimental error: It was very difficult to cut the piece of carrot into a 1×1×1 cm3, so using this method you will definitely get differences in results if you do the practical on two different sessions. A way to improve the reliability of the experiment would be to use the same type of mould for each practical, for example a potato borer.
My 3rd main source of experimental error: In different practical sessions the carrot was ground up in different ways, if it was ground up a lot more, maybe more catalase would get let off. It was also difficult to scrape all the carrot paste into the PONY vial and different amounts might have been left in the two different practical sessions.
My 4th main source of experimental error: To measure out volumes of buffer and hydrogen peroxide solution, I used two 10 ml syringes. These are quite accurate but there are more accurate apparatus like burettes.
My 5th main source of experimental error: Some of the filter paper discs were quite flat but some of them were quite bent, this could affect how aerodynamic they are when it comes to rising to the surface of the hydrogen peroxide solution. One way to improve this would be to iron the discs so that they are all equally flat.
My 6th main source of experimental error: When you put each disc in a PONY vial, the sediment gets disturbed, changing the amount of catalase so making the experiment unfair and reducing the reliability of the experiment. This could be improved by leaving the sediment to settle for a long time, then just pouring off the upper liquid part into another PONY vial.
My 7th main source of experimental error: The stopwatches are quite accurate but people’s reaction time is never the same and also changes during the day. Some people are a lot more alert in the morning than the afternoon, so if they do a practical in the morning their reaction rate will be faster than their reaction rate in the afternoon. This will change if accuracy of the results if the sessions are done at different times of the day. This probably wasn’t very significant because we did both practical sessions in the morning.