-
Test tube rack will be used to place the tubes to ensure that they are not handled and are on a stable surface.
-
10cm-measuring cylinder to transfer 5cm of protein to the testubes and the different amounts of distilled water.
Method- To carry out this investigation firstly a laboratory coat and goggles needs to be worn and hands have to be washed so that the risk of accidents and harm to the eyes or body is reduced and that substance from the hands do not affect experiment. The working desk and area around should be clear of obstructions and loose hair clothing should be tied back to reduce the risk of an obstruction/accident.
All the required equipment then needs to be gathered and set up (e.g.) so that there is no disruption and that the experiment can be carried out in a systematic and orderly manner. All apparatus should be then checked for cleanliness so that that no substance from prior experiments remain as this could affect the validity if the results. If any equipment is cleaned/rinsed out it should be thoroughly dry before using it again so that so that the volume of water does not affect the results. These measures will ensure more accurate results and reduce the chance of systematic errors (values differing from the true value by the same amount) as it will ensure the equipment is clean.
The 5 test tubes then need to be placed in a test tube rack so that the tubes are on a flat surface. This will help ensure that the right amount of volume is transferred and that none is spilt accidentally during the process. The tubes should then be numbered to help differentiate so that there is no mix up between the concentrations. The results table should also be ready so that recording is easier so here is no carelessness and to ensure that the experiment is carried out systematically to reduce the risk of any random errors (lying equally above or below true value).
Start the experiment with the lowest concentration and work up to the highest, so that the procedure is systematic to follow and any trends will be more easily recognised. These measurements will be used as they are fairly small amounts and so I will not have to wait a very long time for the results. This will be useful as the measurements can be repeated to get an average and check the precision of the results.
The 10ml measuring cylinder will then need to be obtained to measure the volume of distilled water needed in the 0.2%. Distilled water will be used as this is cleaner and has no chemicals added to it which I think will be fairer. Distilled water will be poured into the cylinder, but care must be taken that the cylinder is not tilted and is held vertically upright on a stable flat surface, so that the right amount of volume is collected. Also eyes should be kept at the same level as the meniscus. The water from the cylinder will then be transferred to the testube, again making sure that it is on a flat surface so none is spilt.
5cm syringe will then need to be obtained to measure the amount of enzyme needed for the tube. The substrate (Albumen) will then be added t0 the tube using a different syringe. As soon as the protein is in the tube the start clock will be started and the solution will be given a stir with the stirring rod to ensure that the solution is properly mixed. The rate of reaction will be examined by determining the time it takes for the solution to become clear.
The procedure should then be repeated for each of the other 4 measurements. Carry out each concentration three times so that an average from the results can be obtained and that the precision and accuracy of the result can be evaluated.
However carry out all the different concentrations once and then repeat the procedure, in case there is not enough time to repeat it. The procedure is simple to make sure it is repeatable. At the end hands must be washed so that if there were any chemicals on the hand they are removed and do not cause harm.
The results obtained from the investigation will be firstly presented in a table so that the values can be systematically looked at and an average from the three trials can be worked out at the end, so that any tends/pattern or anomalies will be more easily distinguished. However a graph will then be produced as it will allow the result to be visualised better.
Fair testing-To ensure that the test is fair so reliable and accurate results are obtained the only variable that will be changed is the concentration of enzyme as this will be constantly getting higher (Independent variable)and have an effect on reaction time. The control in this experiment will be the protein the protein, albumen as it will have to be kept constant throughout the investigation as this will ensure that the experiment is valid and give accurate results. All other variables that could affect the results will need to be controlled to ensure that the results are reliable and that it is a fair test.
- Only the independent variable is changed enzyme concentration
- A different syringe is used for the enzyme and protein, as this could pollute the substances and affect the reaction time of the other tests.
- All equipment will be cleaned so that any substances do not affect the accuracy of the results
- The test tubes will be moved as least as possible in between the experiments so reaction is not speeded up involuntarily.
- The temperature of the water will be kept constant by placing them in a water bath at about C as the reaction time could be speeded up by warmer temperatures
-
A flat surface will be worked upon so when transferring the water from the syringe to the test tube the right amount is transferred.
Safety-
- A laboratory coat should be worn at all times to reduce any risk of direct harm to the body
- Hands should be washed before the experiment so that any unwanted substances are not transferred during the experiment. Also they should be washed after the experiment to make sure that if their was contact with any substances they are removed.
- Any loose hair or clothing should be tied back so that it does not come in the way and cause a distraction / obstruction or a risk of an accident.
- No food/drink should be consumed as it is not very hygienic.
- Desktop should have only required equipment and otherwise should be clear with no obstructions. All stools should be tucked underneath the table so that there is no risk of tripping over or a spillage.
- Physical contact with any chemicals should be avoided as the enzyme could irritate the body.
- All equipment, especially glassware should be handled with caution and familiarised with so that the handling is proper, so that any risk of spillages/breakages is minimised.
- If there are any accidents If equipment is broken or if there is a spillage they must be reported/ cleaned up straight away to avoid further accidents/disruption
- Precautions must be taken when handling the solutions so that water does not come in contact with the electrical equipment.
Ethical issues- In the experiment pepsin is going to be used which is a digestive enzyme produced in the stomach that breaks down proteins. The enzyme had to be obtained from an animal, and so there are many moral issues which arise from this. Therefore I will try not to use the pepsin excessively.
Results- The result obtained from the investigation is as follows:
Table recording the reaction time of solution with different concentrations of enzyme
The Results have been rounded to 1 decimal point and presented results in a table as it is easier to systematically look at all the values and work out the average and the rate and also distinguish any errors or anomalies clearly.
The results above are fairly precise as the values are quite close to each other. Also they are accurate as the differences in results for the repeated experiments for the same concentrations do not vary a lot, with the biggest difference being in the 1% concentration with a difference of 1minute and 39 seconds.
A mean from the data has been calculated as it descriptive statistic and describes a set of quantitative data and tells me the average of the data. Because the data is symmetrical, the mean was determined by adding all of the data values together for the 3 trails and then dividing the total by the number of data values
A line graph has been presented below from this data. The data has then been presented in a scatter graph as it allows a more visual representation of data to be made and trends /patterns can be more easily identified. Also because of the line of best fit anomalies can be more easily seen, and it s tells us whether two variables are correlated, i.e. whether a change in one variable is accompanied by a change in the other variable. It will tell you whether the relationship is a positive correlation (both go up together) or a negative correlation (one goes up as the other goes down).
Conclusion-as the concentration of enzyme increased the time decreased, hence the rate of reaction got faster; consequently it took less time for the solution to become clear. From these set of results it shows that the prediction was correct.
From the results indicated in the graphs as the enzyme concentration increases the rate of the reaction increases linearly, because there are more enzyme molecules available to catalyse the reaction. At lower concentrations, or when there was insufficient enzyme present, the reaction did not proceed as fast as it otherwise did. This is because the active sites on most of the enzyme molecules are not filled because there are not enough enzymes. Higher concentrations caused more collisions between the molecules, because as the table of results show the time for the reaction to take place decreased but the rate increased. By increasing the concentration there are more enzyme to catalyze the reaction and fill their active sites.
The expected was as follows:
as the higher the concentration of enzyme the higher the rate of reaction.
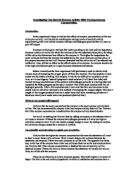
Rate
1/t x 100
Concentration of enzyme
In the graph a line of best-fit shows that the concentration is directly proportional to the reaction rate i.e. a linear line. This shows a clear pattern, because it shows that the higher the concentration of enzyme the faster the rate of reaction. This is because there are more enzyme molecules available to catalyze the substrate molecules.
After studying my graph it is good enough to support a valid conclusion because an increase in the concentration increases the reaction time and it took less time for the solution to clear. The rate goes up steadily by about a second each time starting with 9.68 and finishing with 5.6 this shows a systematic relationship between the concentration and the rate. Also because there are no anomalies the results are more reliable.
The graph is also applicable as when compared with other the pattern was similar.
Evaluation-In general the procedure used was suitable for the experiment, however to obtain more reliable and valid results, improvements could be made.
- A preliminary could have been done to recognise weaknesses in the procedure and then make or add changes to the experiment to provide more reliable and accurate results.
- Whilst collecting the measurements goggles had been worn and this could have obscured visibility and this was personal interpretation. Instead of relying on the human eye which is not hundred percent accurate, an electronic device would be more suitable as it would be more precise. A computer setup device could be used such as a light and sensor combination. The lamp would be useful in detecting the clearness of the solution, which would result to the sensor giving off a noise. (A possible solution could also be that an automatic clock is also, which would give more definite results).
- Enzymes do not form chemical bonds with the substrate, after the reaction, the products are released and the enzyme returns to its normal shape and is unchanged. As a result, the enzyme molecule can be reused. However if there are more enzyme molecules than are needed, adding additional enzyme will not increase the rate. However the maximum velocity of a reaction is reached when the active sites are almost continuously filled this is the ‘saturation point'. In the experiment larger concentrations could have been used to identify at what point this occurred.
- The reaction tome in starting and stopping the clock is bound to have been a bit different
- The same mixing rod was used to mix all the solutions; this could have transferred particles from one of the tubes to the other, and so is not very reliable.
- Thought was not taken into account how to control other factors that would have affected the time. For example a thermometer and water bath could have been used to monitor and keep the temperature constant and a buffer could have been used for the water PH.
To improve the reliability-large replicates of the results should be made using the same procedure will be used and results that vary considerably should be discounted or repeated. As it would allow seeing the degree of error as greater the variation of replicates the greater the degree of error
Further work- Only one type of enzyme was used therefore it can not really be concluded if this is the general trend for all enzymes. Another investigation with different enzymes but using the same protein could be conducted to see if the general trend is the same. To ensure that the results would be accurate the same methods, apparatus and precautions would need to be taken. However the improvements and modifications mentioned would need to be taken into account
Bibliography-
- www-saps.plantsci.cam.ac.uk/worksheets/activ/prac2.htm
- www.ull.chemistry.uakron.edu/genobc/Chapter_
- www.chm.bris.ac.uk/pt/ajm/adrian.html -
- Salters-Nuffield advanced biolgy AS