Wires: The wires used are made of copper with plastic insulation. The plastic insulation comes in a variety of different colours so different component links can be easily identified.
Variable Resistor: A larger component made of many coils of wire. Theses coils create resistance throughout the circuit. The amount of coils the electric flow encounters can be altered using a manual slide on the resistor.
Voltmeter: This apparatus is used to measure the voltage of a circuit. It measure the voltage to two decimal places. Therefore it is quite precise.
Ammeter: This apparatus is used to measure the current of a particular circuit. It measures the current value to two decimal places. Like the voltmeter this piece of apparatus is fairly accurate.
Ruler: Used to measure equal distances along the slide of the variable resistor.
Pencil: Used to make markings along the variable resistor. This is so that the slide can be put accurately in the same place each time reducing the chance of errors.
Accuracy and Sensitivity:
The results of this experiment will be taken to two decimal places, in general.
The exception being if it were, for example, 0.20A it would simply be recorded as 0.2A. Another problem is that with the voltage the values are constantly changing. To overcome and improve the situation the highest value seen on the voltmeter added to the lowest value seen all divided by two should give the average voltage for that particular repeat. This will be the same for every voltage repeat through the experiment.
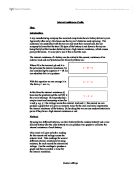
Theory:
There is a drop in terminal potential difference through the power supply. This can be explained using internal resistance.
Every power supply will suffer from some internal resistance; this is simply due to the fact that the substances from which it is made will have a resistance. This internal resistance cannot be removed.
External load = R
Internal Resistance = r
Current = I
Voltage = V
Emf = ε
When the external load is connected to the power supply there is a flow of current no only across the external load but also through the internal load. Due to this there is resistance within the actual component as well as the external load. This means that the potential difference (voltage) will be lower than the Emf due to the energy supplied to the internal load. This creates internal resistance.
Therefore the resistance equations can be applied:
ε =IR + Ir
applied to external load
V= IR
Therefore combining the two:
V= ε – Ir
Main Investigation
Prediction:
Based on my background knowledge and the theory I have researched I predict that as the resistance is changed this will affect the voltage, current and internal resistance. As the voltage decreases the current will slightly increase. This makes the internal resistance decrease. Alternatively if the voltage increases the current will decrease and therefore internal resistance will increase.
Analysing the Results:
The results will be taken. Three repeats for voltage on each resistance setting and on each voltage setting. Three repeats for current for each resistance and voltage setting. The results will then be averaged. This means that there will be one value for voltage and one value for current for each voltage and resistance setting. This averages will be plotted on a graph and the results analysed using the graph.
Method:
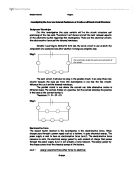
- The equipment will be set up correctly so the experiment can be conducted safely and efficiently. (see fig.1)
- The power pack is turned to the desired voltage setting. In this case starting at 2V and working upwards.
- The current is set to DC
- The ruler and pencil are used to mark equal lengths along the resistor slide.
- Prior to beginning the changes in resistance the Emf of the power supply must be recorded.
- The voltmeter alone is connected in series, using the wires
- The power pack is turned on and the voltage recorded
- This is to be done for each voltage setting which will be used in the experiment
- The Resistor slide is then moved to the first mark
- The power is turned on and voltage and current values recorded.
- Once values are recorded accurately the power is turned off
- The resistor is then moved to the next mark
- The power is once again turned on and the voltage and current values recorded.
- The resistor slide is then moved to the next marker
- Once all markers have been recorded move the slide back to the orginal marker and repeat the steps
- This will be repeated three times for each resistance marker for each voltage setting (2V, 4V, 6V, 9V, 12V)
- The results are taken and recorded in a table.
Results:
Tables showing the voltages and currents for three voltage settings.
2V Setting: Emf= 1.23V
4V Setting: Emf = 4.7V
6V Setting: Emf = 6.66V
Tables of averages must also be compiled as this allows voltage and current to be seen as one point and therefore more easily plotted on a graph.
Tables showing the average voltage and current for three voltage settings.
2V Setting:
4V Setting:
6V Setting:
These averages allow for the graph to be plotted more easily.
Results highlighted in orange represent possible anomalous results. However the results although they seem extreme still fitted very close to the line of best fit.
Graph showing the results for the 2V setting and plotting voltage (y-axis) against current (x-axis).
Graph showing the results for the 4V setting and plotting voltage (y-axis) against current (x-axis).
Graph showing the results for the 6V setting and plotting voltage (y-axis) against current (x-axis).
By analysing the graphs and rearranging the equation V= ε – Ir new results tables can be formed showing the internal resistance for each external resistance value.
V= ε – Ir V – ε = r
-I
Tables showing Average voltage, current and the internal resistance for each external resistance setting.
2V Setting: Emf = 1.23V
4V Setting: Emf= 4.7V
6V Setting: Emf = 6.66V
Conclusion:
I conclude that overall the experiment was a success. Although there was a significant change in gradients of separate graphs the points were still close to the line of best fit. This suggests that there was no problem with the method of the experiment. Any abnormal results can only be explained by possible faults in the electrical equipment which is beyond control.
Referring back to my prediction: Based on my background knowledge and the theory I have researched I predict that as the resistance is changed this will affect the voltage, current and internal resistance. As the voltage decreases the current will slightly increase. This makes the internal resistance decrease. Alternatively if the voltage increases the current will decrease and therefore internal resistance will increase.
My prediction also suggests that the results are accurate. The results show that as the voltage decreases when the resistance is changed the current increases. And using the calculations and equations from the theory the internal resistance was also shown to decrease. This is more or less what was stated in the prediction.
Therefore I conclude that the results gathered are sufficient and overall the experiment was successful.
Limitations:
- Unidentified Faulty equipment: give changing or false results
- Environmental conditions: high room temperature may affect resistance and effect results for example.
- Inaccurate method of measuring the external resistance: may give different readings for repeats.
Improvements:
- Test equipment beforehand to ensure everything is working correctly
- Take all the results at the same time to keep experiment in similar environmental conditions throughout.
- Possible computerised way of setting resistance to make sure the value for external resistance is always for repeats.