0.46 0.47
At 9 volts, the results I got were very good. The bulb started to light at 1.35 volts, and when I slid the resistor up to the highest it could go to, the bulb was very bright. 9 volts:
V/V I/A
1. 0.76 0.58 2. 1.13 0.68 3. 1.50 0.73 4. 1.95 0.81 5. 2.30 0.87 6. 3.46 1.05 7. 4.18 1.19 8. 4.85 1.23 9. 5.67 1.34
10. 6.45 1.65
I decided that I would turn the power supply to 12 volts, because I might find better results. The bulb became extremely bright as we turned the rheostat up.
12 volts:
V/V I/A
1.42 0.72
2.02 0.83
3.20 1.02
4.67 1.23
7.85 1.59
11.18 1.90
As a result of this preliminary work, I decided to use the power supply on 9 volts. I will go from 0.50 amps to 1.70 amps. I found that when I turned the power supply to 9 volts, the results were the best. On the graph, the line was bent, which means that the voltage increased.
Experiment we used a 3-½ volt bulb and 4 was the maximum voltage we could use on the power supply. First, I turned the power supply to 2 volts. There was a faint glow at the beginning, and as I slid the rheostat up the bulb got fairly bright. 2 volts:
V/V I/A
0.52 0.10
1.14 0.14
2.11 0.20
I found that these results were quite good, but I wanted to see if the bulb could get any brighter, so I turned the power supply to 4 volts and recorded the results.
First we decided to go up every 0.10 volts to see if we could gain good results.
4 volts:
V/V I/A
1.65 0.18
1.75 0.18
1.85 0.19
1.95 0.19
2.05 0.20
2.15 0.20
2.25 0.21
2.35 0.21
2.45 0.21
2.55 0.22
I found that there was a trend from the current when I went up by 0.10, but the results were too close together so I decided to try going up by 0.20 volts.
4 volts, going up by 0.20:
V/V I/A
1.65 0.18
1.85 0.19
- 0.20
- 0.21
- 0.22
- 0.23
- 0.24
3.05 0.25
- 0.26
- 0.27
The bulb was fairly light at the beginning, but as I moved the rheostat along the bulb got much brighter. At the end it was extremely bright.
As a result of the preliminary work with the bulb (3 ½-volts), I decided to use the power supply on 4 volts because I gained better results than those at 2 volts did. At 2 volts the results were too close together. The results we have from 4 volts will make a straight line on the graph, but they are more spaced apart than the results from 2 volts. The straight line from the graph shows that the bulb can not have heated up very much. I will go from 0.18 amps to 0.27 amps and I will take results every 0.20 volts. We couldn’t have used 6 volts on the power supply because the voltage would have exceeded 4 volts, which was the maximum.
Variables
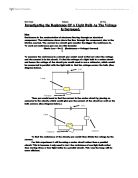
The factors which can affect the resistance could be the thickness of a wire i.e. thicker the wire, the lower the resistance, as the electron flow has a larger volume to travel through than with a thin wire. The temperature can also affect the resistance because inside a piece of wire showing the free electrons-the flow- and the metal ions, If the temperature is increased then the free electrons will hit the metal ions creating more resistance.
The independent variable, which I intend to change, will be the rheostat.
The dependant variable, which I intend to observe, will be the current and the voltage, which changes as a result.
The control variable, which I will keep constant, is the bulb, the thickness of the wires and the battery pack. This will result in a fair test if I keep it accurate throughout the experiment.
I think that the independent variable, the resistance, will change the dependant variable, the current, as voltage is the charge flowing and hence is related to the amount of current. I think that as I increase the voltage, the current will also increase. The amount of this should be nearly the same as the power is being transferred; though the current should be slightly lower due to loss of energy through resistance and heat loss.
To make this experiment fair, I will keep the control variables (the resistance, the bulb and the thickness of the wires) the same. I will also only change the light bulb to check if my results were correct. I will repeat the experiments so I can get better results.
Method
List of equipment:
- Power pack, which will be needed to increase the load of power.
- Ammeter (at 10 amps) to measure the current.
- Voltmeter (at 20 volts) to measure the voltage.
- Rheostat, which changes the resistance in a circuit, and therefore changes the voltage and current in a circuit.
- 3½-volt/12-volt light bulb
- 8 wires to connect up the circuit.
When I set up the circuit with all the equipment I need, I will record the results from the ammeter and voltmeter. I will observe the changes in the light bulb as I slide the rheostat up. I will do two experiments with a 12-volt bulb, using two different bulbs, because that is my main experiment, and I will do one experiment with a 3 ½-volt bulb. Using different bulbs may give slightly different results as the metal filament may be different but the general pattern will still be the same.
Analysis
On the both my graphs the pattern is that when the voltage increases, so do the current and the resistance. From the graph you can see that the voltage and the current have increased because (from 12-volt bulb no.1) the first point is 1.05 volts and 0.54 amps, and then the tenth point is 7.80 volts and 1.60 amps. The resistance of the light bulb increases, as it is more difficult for the electrons to flow through the filament as the metal ions are vibrating and slowing down the electrons. The graph of current and voltage shows that as the potential difference increases then so does the current but not at the same rate, see the shape of graph, because the temperature increases and Ohm’s law is not obeyed. On the 3 ½-volt bulb Ohms law is obeyed because the graph is a straight line, which means that the temperature has not increased.
My results for the 12-volt bulb were good enough to support my prediction and for this reason I think my investigation was worth carrying out. As you can see from these results, that the current and voltage increases.
Results for 12-volt bulb no.1
I set the power supply to 9 volts and recorded ten results going up by 0.75 volts.
At the beginning the bulb did not light at all, but as I moved up the resistor, the bulb began to get bright. When I slid the resistor up the most it could go, the bulb was extremely bright.
V/V I/A
1. 1.05 0.54
2. 1.80 0.75
3. 2.55 0.88
4. 3.30 1.03
5. 4.05 1.13
6. 4.80 1.24
7. 5.55 1.31
8. 6.30 1.43
9. 7.05 1.52
10. 7.80 1.60
Results for 12-volt bulb no.2
I set the power supply to 9 volts and recorded ten results again, going up by 0.75 volts. The bulb did also not light at all, but as I moved up the resistor the bulb began to get bright.
V/V I/A
1. 1.35 0.52
2. 2.10 0.67
3. 2.85 0.77
4. 3.60 0.86
5. 4.35 0.95
6. 5.10 1.03
7. 5.85 1.11
8. 6.60 1.17
9. 7.35 1.24
10. 8.10 1.31
Results for 3 ½-volt bulb
I set the power supply to 4 volts, and I decided to go up by 0.20 volts. We found a trend in the results, they went up by only 0.1 amp.
V/V I/A
- 0.16
-
0.17
- 0.18
- 0.19
- 0.20
- 0.21
- 0.22
- 0.23
- 0.24
- 0.25
As you can see from the 3 ½-volt bulb, the results only went up by 0.1 amp, which meant that the bulb didn’t heat up very much, meaning that there would not be a curved line on the graph, just a straight one. This is because the voltage has not increased very much.
Evaluation
There are always errors in experiments and that can’t be avoided unless you have very accurate equipment. Further work to this experiment could have been done with a new, reliable rheostat, which would give me more accurate results. The rheostats are very hard to move which could make it harder to achieve the accurate voltage/current reading. Also when I try to read the ammeter it fluctuates rapidly before settling on a final result, which also makes the results less accurate. Also the light bulbs flicker a lot which makes the current and voltage readings flicker. We can avoid this by having new bulbs.
My results were quite accurate because I didn’t get any anomalous results; they were always on the usual trend of the line. When I repeated the experiment with the 12-volt bulb the majority of the results are very close to the original set, as you can see from the graph. My graph was quite accurate because the points joined up to a smooth curve, I think overall my experiment was quite effective.
To extend this experiment by choosing to look at other variables, which would affect the rate of resistance, such as the materials in which the wire is made from, the cross sectional area of a wire, the number of components in a circuit, or the length of a wire. A different component such as an electrical heater could also be investigated with the variable of voltage. If we had more time to do the experiment, then the results could have been more accurate and the graphs would have been better.