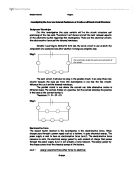
Diag parallel with two cells:
Prediction for graphs:
I expect the graphs to follow the following trend below. I have derived this from preliminary work on current and voltage using a wide range of resistors. The readings should obey ohms law.
V
I
Apparatus:
For this investigation I will need the following apparatus:
- Several resistors ranging from 12 ohm to about 220 ohm. These resistors are gold band with an error margin/ percentage of 5%. This is a key variable which will enable to me to identify obvious trends
- Voltmeter – preferably digital for accurate readings as the analogue can change position uncontrollably due to resistance form heat coming form cells
- Ammeter – preferably digital. These meters should be tested before use
- Clips and connecting leads
- 2 cells – alkaline batteries with a 1.5 volts each
Diagram:
Below are the different circuits I amusing for this investigation. There are four different circuits with the cells positioned differently each time.
1.
External resistor!
(value is varied)
2.
3.
Process / Method:
For this investigation I am going to keep the following factors constant in order to gain an accurate result:
- I am going to use the same ammeter and voltmeter for each circuit reading
- I will use the same wires
- I will use the same band resistor (gold) and value for each circuit test
- I will also use the same batteries throughout the investigation
The following are variables that I will change:
- the value of resistor in ohms will change in the circuit after it has been tested, ranging from 12 ohms to 220 ohms
- I will also change the structure and positioning of the batteries in each circuit according to circuits in the diagram section
The two cells will first be connected in series with ammeter and resistor and the voltmeter will be in parallel with the resistor. The next circuit will involve the two cells being in parallel and the ammeters will also be in series and voltmeter too. The last circuit will involve one cell in series with the resistor and ammeter and voltmeter in parallel with the resistor.
During the investigation I will measure, the voltmeter readings, the ammeter readings which will be in milliamps because these are appropriate units to use. These will be approximately to three s.f. or to the nearest thousandth, because calculating to the nearest amp will result in all readings being near enough the same, which doesn’t help with the investigation when plotting the graphs or comparing readings, therefore milliamps which is a more accurate degree of accuracy is used. The resistor value used is also noted. I will also consider the percentage error of the resistor and the extra resistance during the experiment due to the cells heating up due to the kinetic movement of electrons at a fast pace. This will alter the readings and will give a value far from the ‘real’ value.
I will take readings of voltmeter and ammeter for about 10 resistors, as this is sufficient enough to generate values for a voltage/ current graph. The graph will enable me to find the e.m.f and internal resistance. I will repeat the experiment twice or three times and generate an average for accuracy. I do not expect the difference to be large but it would be foolish to ignore these alterations as this makes the results inaccurate and an unfair test.
After each set of readings, the switch will be opened because when the current flows, chemical reactions in the cell can cause the e.m.f to drop or the internal resistance to increase, thus the readings will become a degree inaccurate.
To check the accuracy of the ammeter and voltmeter, it will be checked that they both read zero when no current is flowing. If it does not, then the faulty equipment will be replaced. Once the results are recorded, they will be repeated to check if they are similar values. If there are any extreme inconsistencies, then they will be discarded. This will then be carried out with all the other resistors.
Precision in this experiment is improved by using a wide range of values of resistance. This means that the dependant variable changes significantly so that any trends are more obvious and can be identified easily. Precision will also be improved as the uncertainty value will be calculated. This can be used to gauge the reliability of the results. Repeating the experiment and taking averages increases the likelihood of having results near to the 'true' value of what is being measured.
The resistors band will also be considered when using readings. The resistors are gold band which have a 5% error. A 1% error would be much more accurate but the investigation must still take place with gold band resistors. However this will be carefully considered when the results are generated.
If all these points are considered and the results show a pattern or trend as expected, it can be assumed that the results are quite reliable. Any obviously anomalous results would decrease the reliability as they are not expected and probably the result of an error in the method or equipment.
Safety aspects considered:
There are some aspects which need to be considered when carrying out this investigation. The first aspect is that the resistors can become too hot as the experiment goes on, therefore the resistors should be approached and handled with care to avoid minor burns. Using a cloth or glove would avoid this but it is not totally necessary as it is usually the smallest value resistor that does this. I.e. 2 ohm
Data Manipulation:
I am going to record my results in a spreadsheet and then create graphs showing voltage against current using this data. When creating graphs for my results, I am going to include error bars where the error margin will be 5% so that slight errors in reading my results and accuracy in the equipment are accounted for. I will then draw a best-fit line so that I can work out the internal resistance by calculating the gradient.
From the results I can calculate the e.m.f and internal resistance, but first I will draw the graph for voltage against current where voltage is on the y axis and current on the x axis.
The current = sum of potential difference (kirchoffs second law)
Since:
Voltage = current * resistance, IR will be come just V.
V = -Ir + E is derived form E = V + Ir
This equation is now in the form y = mx + c
y potential difference
m negative internal resistance
x current
c e.m.f
Therefore if the equation of the line is found then so can the e.m.f. If gradient can’t be found by using the graph then a value of I can be substituted ( x axis) into the equation and then the equation can be solved to find specific component, r or E.
Repetition of results
The investigation was repeated twice foe each circuit and separate resistor. It did not need to be repeated anymore than that because the findings were near enough identical so there was no need for repetitions. However, the anomalous result should have been repeated again but this can be ignored to discuss the findings further.
Anomalous results from the graph:
There was only one anomalous result on the graph and data table. The anomalous result was under the series circuit with two cells. When the resistor was 100 ohms, I left the circuit closed and forgot to open the circuit after my last reading of the resistor of 68 ohms. This resulted in anomalous result which is clear from the table.
The reason for the potential difference dropping could be due to more current flowing and causing chemical reaction in the cells therefore increasing the internal resistance which resulted in the potential difference dropping unusually.
There were fortunately not any other anomalous results which is very fortunate and this meant I had a reasonably more accurate result table compared to others in the group, as I had compared my results with others and I believe my results are extremely accurate to full human capabilities excluding other physical factors of cell heating up and creating resistance and the fact the resistors could also have been faulty and below or above the stated value they were given by the manufacturer.
Graph analysis
The graph showed a relatively straight line which corresponded to my graph hypothesis for each circuit.
In series circuit with two cells the graph showed a relatively straight line with the p.d across each resistor ranging form 2.5 – 3.0 volts. This is very close to the e.m.f 2.96. As the current was increasing the voltage was decreasing which obeyed ohms law of ohmic conductors but inversely proportional. I extended the line to calculate the e.m.f and substituted the value of x (I) for the current into the equation V = -rI + E to correspond to y = mx + c
In a parallel circuit the trend is exactly the same to the trend in the above circuit, however the values were halved. That was the only difference.
In a series circuit, the trend was exactly the same as the trend on the graph showing a V against I for parallel circuit with two cells, which meant is identical to the series circuit with two cells but exactly halved.
Results table for series circuit with two cells
This was repeated four times and the two best set of results are below as no more repetition was needed.
Average readings were:
Parallel circuit with two cells
This was repeated twice and there was no need for any more repetition.
Average readings were:
Series circuit with one cell
The practical was repeated twice and no more than that because the results looked accurate and as 9i had expected
Average readings:
Results (findings from graph)
(I used 0.040 mA as the current reading from the graph to find the e.m.f and internal resistance)
For the series circuit with 2 cells:
e.m.f = 2.96V internal resistance = 2.5 ohms
y = mx + c
V = -rI + E
2.86 = (-r * 0.04) + 2.96
-r = -2.5 ohms
For the parallel circuit with 2 cells:
y = mx + c
V = -rI + E
1.400 = (-r * 0.04) + 1.450
-r = 1.25 ohms
For series circuit with one cell:
y = mx + c
V = -rI + E
1.425 = (-r * 0.04) + 1.475
-r = 1.25
Basic conclusion:
- The e.m.f in parallel and series with one cell is half of the e.m.f in series with 2 cells.
- The internal resistance is also halved in parallel with two cells and in series with one cell compared to series with two cells which has double the internal resistance
Checklist of results:
- suitable units – (mA)
- practical number of recordings – 10
- logical range of results – 12 – 220 ohms
- Anomalous results noted and discussed
- Applicable repetition conducted
Changes in procedure/plan
I did not need to adjust my plan greatly. However my method was corrected to some extent. In my original plan, I did not mention the key point of opening the switch after each reading and I only realised the effects of this during the practical investigation so therefore I restarted the practical to evade erroneous results.
I also changed the unit measurement of current I was going to use. In my original plan, I intended to use current to the nearest amps but I realised this was too inaccurate as the results were all rounded to the same value of 1 amps so therefore I decided to use milliamps which meant the current was measured to the nearest thousandth amp. This created more accurate results as the change in current was far more noticeable and therefore utilizable for the investigation.
The circuit design of one of my diagrams was also removed. It was an irrelevant circuit which could not aid the investigation and at the same time created a short circuit which would have probably blown the two cells. The diagram of the fourth circuit proposal is below. It was a very ‘wild’ and foolish suggestion and I fortunately I realised it was short circuit (The cross indicates it was not and can not be used in this investigation)
Diag:
Conclusion:
Comparing the e.m.f and internal resistance of the three circuits:
The e.m.f for:
Series circuit with two cells - 2.96 V
Parallel circuit with two cells – 1.45 V
Series circuit with one cell – 1.475 V
As you can see the e.m.f does show a relative trend. The e.m.f is approximately double the em.f of the series circuit with one cell and the parallel circuit when it is in series with two cells.
This finding does not totally correspond with my hypothesis but it is now understandable. However, my hypothesis for the series circuit with one cell having an e.m.f half of the e.m.f of a series circuit with two cells is correct and only has a difference of 0.01V. This small inaccuracy could be due to a number of things; however it is marginally inaccurate so it can be acceptable as plausible. My hypothesis was correct because the series with two cells has double the e.m.f of a series circuit with one cell, so it was relatively obvious to expect this hypothesis to be correct.
However my hypothesis about e.m.f in a parallel circuit being equivalent to the e.m.f in a series circuit with two cells was incorrect. The e.m.f in parallel was actually approximately half of the series circuit with two cells. The reason for this is due to the resistance in parallel being half of the resistance in series circuit with two cells, which meant it was equal to the resistance of a series circuit with one cell. Therefore, the e.m.f of the parallel circuit and series circuit with one cell should be equal but my results showed that in parallel the e.m.f was slightly lower by approximately 0.025 V. This is a very small inaccuracy but reasons for this could be due to a number of factors discussed in the evaluation.
The internal resistance is another key and foremost factor of the investigation.
- The internal resistance – series with two cells – 2.5 ohms
- Parallel with two cells – 1.25 ohms
- Series circuit with one cell – 1.25 ohms
My hypothesis was 100% correct when predicting the internal resistance. I knew it would be correct because I used the relevant equations of finding total resistance in parallel and series, considering the internal resistance as a resistor:
For a series circuit the total resistance is equivalent to the external resistance (R1) + internal resistance (r1) * 2. In a series circuit, I expected the internal resistance to be half of the series circuit with two cells -> 1* (r1). For a parallel circuit, I also expected the internal resistance to be half of the internal resistance of a series circuit with two cells, due to the circuit formula for total resistance:
1/RT = (1/R + 1/r) + (1/R + 1/r)
1/r + 1/r = it is also equal to internal resistance in series with one cell
1/r + 1/r = it is also ½ of the internal resistance of a series circuit with two cells
Using experimental data I can justify my conclusion:
The series circuit with two cells:
Internal resistance = r*2 = 1.25 * 2 = 2.5ohms
The parallel circuit with two cells:
Internal resistance = 1 /2*r = 1 /2.5 = 2r = 2.5 > r = 1.25 ohms
The series circuit with one cell:
Internal resistance = 1 /1.25* 1 cell = 1.25 ohms
Physics principles involved:
The main physics principles involved were the equations used to find voltage and resistance in a series and parallel circuit, but also the equation E = Ir + IR, was needed to create the equation V = -rI + E which corresponds to y = mx + c. From this the e.m.f and internal resistance could be calculated where E was the y-intercept and –r being the gradient of the graph when voltage is plotted against current. The I is the selected current value on the x axis and this same value was used fir for each circuit calculation.
The final conclusion
The main findings from the investigation were:
- The e.m.f was double in series with two cells of the e.m.f in series with one cell
- The e.m.f in a parallel circuit was approximately half of the e.m.f in a series circuit with two cells
- The internal resistance also followed this trend
The reason for this trend is that the internal resistance is halved in a parallel circuit, thus the parallel circuit becomes a physical clone of the series circuit with one cell. This explains the extreme similarity between the readings of both circuits.
The aim of the investigation was to find some sort of relationship between the positioning of a cell and the e.m.f and internal resistance found.
From this aim, I have found a trend. The first trend is that, in a series circuit the internal resistance is multiplied by the number of cells. The e.m.f is also just below the correct or specified e.m.f of 3V. The ‘lost volts’ could be due to the internal resistor.
The second trend is that in a parallel circuit with the same number of cells, the e.m.f and internal resistance is halved. This is due to the internal resistor being in parallel with each other, which results in the total internal resistance being half of the total internal resistance of a series circuit with two cells, which also halves the current and therefore means the e.m.f is also halved.
The series circuit with one cell has half the values of the series circuit with two cells, because half the number of cells has been used which means that the readings and e.m.f and internal resistance are also halved. By decreasing the number of cells in series the e.m.f and internal resistance drops
New formulas: The e.m.f can be calculated each time, when the cells are decreasing by one in series using the following formula:
N - e x = E (new e.m.f)
N e x E
(* The minus sign could be plus if adding cells each time)
Another formula can be used to find e.m.f in parallel when same circuit in series is formed and e.m.f for series version is calculated:
n/2 = E (new e.m.f)
Internal Resistance:
The internal resistance also is halved from series with two cells to parallel with two cells. The formula for finding the internal resistance if more cells are added in series is below:
(x) r + (x2) ry = Ry (new value of internal resistance in new circuit)
Evaluation:
Main limitations of conclusion:
The factors that caused inaccuracies are as below. These factors therefore meant that my conclusion was to a degree unreliable. However the limitations are all beyond human capabilities except the manufacturing of good resistors which are equal to their value:
- The resistor value is actually incorrect and is much lower than valued. This increases the current and reduces the e.m.f therefore creating an inaccuracy
- The circuit could have been left closed after each reading, therefore the e.m.f will drop as the current flows, because there will be chemical reactions taking place in the cell which could also increase the internal resistance
- The error percentage values of the resistors used could be incorrect and much higher than specified. This could increase or decrease the current depending on the value of the resistor. This therefore could either increase/decrease the current depending on the value of the resistor. This therefore could either increase/decrease the e.m.f causing more inaccuracies.
- The battery heating up can also increase the resistance because more chemical reactions take place as the current is flowing in the cell, this therefore makes the ions in the cell vibrate, and as more kinetic energy is supplied the ions vibrate more and transfer that kinetic energy into heat energy and means the electrons will have more obstruction from the ions, thus current will decrease as the resistance increases.
The trends in my results are very clear and I was fortunate to have a good set of results which showed a general trend. The trend therefore enabled me to create a stimulus to discuss further. However these trends are only there because care was taken into the practical and a lot of repetitions needed to ensure that a decent set of results were gained.
The graphs showed a very clear trend which all follow the line of best fir so that was very pleasing
How accurate is the data – testing the inaccuracies
I will create a another graph for voltage against current to find the e.m.f and internal resistance but this time I will use the graph to also find a range of lines of best fit and I will use two results to show this. The graph I will be using will be the one for a series circuit with two cells.
Series circuit with two cells:
First range of line of best fit - +1.25
Second range of line of best fit - -1.25
Therefore the error margin for original values is approximately plus 0.04% and minus 0.04% -> 0.04%+-
How could the investigation process be enhanced?
It is difficult to suggest major improvements fro this investigation. However below are some of my improvements that I would like to happen in any future investigation. These factors concentrate mainly on
- The value of resistor specified must be used. This should be checked before used
- Any faulty equipment should be checked and replaced. In my investigation I did not check for any faulty equipment. My results had a positive outcome but I believe many others using the equipment given had faulty equipment therefore it is fair to say that any faulty equipment would affect the result and cause inaccuracies and therefore should be avoided.
- The time should be recorded for each resistor in a closed circuit, or all circuits with different resistors should be in a closed circuit for a fixed time. This ensures that there is not excess current or voltage recorded and therefore not being part of the results and causing limitations to the investigation
- There should be more range of resistors and more repetitions should be taken for this investigation and the average should be used as the more the objective is conducted and the more results and pieces of data generated ensures that the investigation is far more accurate
- The investigation could also be carried out to check how different value e.m.f that cells have and how varied the internal resistance values are
- The e.m.f and internal resistance could also be investigated further to show if there is some sort of relationship between the connecting leads and the values of e.m.f and r.