Investigating the effect of pH on the activity of phosphotase enzymes
Biology coursework:
Investigating the effect of pH on the activity of phosphotase enzymes
Background information
Enzymes are biological catalysts, which speed up reactions. They have specific active sites, and are not used up, but (in theory) can be used over and over again.
They have optimum working temperatures, and likewise, an optimum working pH. The point of this experiment is to find out the optimum working pH of the phosphotase enzyme. The word equation to a reaction involving a phosphotase enzyme would be:
Enzyme + Substrate E/S Product + Enzyme
The rate of reaction of an enzyme-catalysed reaction depends on 2 things:
. How fast substrate is being used up;
2. How fast product is being formed
The phosphotase enzyme occurs in both animal and plant tissue. If catalysed, the breaking of phosphotase bonds in organic phosphotase leads to formation of phosphates.
0. Organic phosphotase Phosphate + organic residue
Phosphotase enzyme
Substrate product
This reaction releases phosphate ions into the metabolic pool. Phosphate is an essential component of biological molecules. The phosphate is found in DNA, RNA, ATP and phospholipids (in cell membranes). Phosphotase is also associated with allergens in pollen grains.
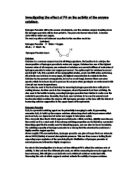
Important graphs
Graph 1
Steeper side
Optimum temperature
Graph 2
The optimum pH point
depends on which pH the
enzyme is used to Optimum pH
Plan
I will test which pH would best suit the phosphotase enzyme, and if at all, how will this affect the rate of reaction of the phosphotase enzyme?
I will try to do this experiment as fairly as I can, using as near the same number of enzymes I can get, and same amount of each variable that I could test. I will then place these enzymes under the same conditions, but I will change one condition - the pH of which they are placed in. This shall show how the rates of reactions have changed. The method that I used is as follows:
* First, I will label 8 microfuge tubes, and label my initials, and info on them, so I can recognise that they are mine, and also their contents.
* Then, I will get 2 mung bean tips (because this is where the phosphotase enzymes are stored), and I place them inside a microfuge tube each, and then crush and macerate them. This will release the enzymes from the shoot.
* Then, I will add 0.5 ml of distilled water to each microfuge tube that has the crushed mung bean shoots.
* After this, get another microfuge tube, and add water to about the same level as the tube with both the distilled water and the mung beans.
* Repeat this stage for all the microfuges with the mung beans inside.
* Then place all the tubes into a centrifuge, and spin for 5 minutes, using the water filled tubes as balancers for the centrifugal process.
* After spinning, take all the microfuge tubes, and then from the ones with the mung beans, there should now be a clear supernatant containing all the phosphotase enzymes.
...
This is a preview of the whole essay
* After this, get another microfuge tube, and add water to about the same level as the tube with both the distilled water and the mung beans.
* Repeat this stage for all the microfuges with the mung beans inside.
* Then place all the tubes into a centrifuge, and spin for 5 minutes, using the water filled tubes as balancers for the centrifugal process.
* After spinning, take all the microfuge tubes, and then from the ones with the mung beans, there should now be a clear supernatant containing all the phosphotase enzymes.
* Using a graduated micropipettor, take as much of this clear supernatant as possible, without knocking the solid left overs of the mung bean.
* Place the enzymes into a microfuge.
* Using a graduated micropipettor, I will get 100 ul of a buffer solution (which is the variable, with which I can change the pH of the experiment), and then I will place this all into a microfuge, washing the micropipettor after each
* I repeat this stage for some 4 more microfuge tubes.
* Then, add 20 ul of PPP substrate into each of the microfuge tubes, again washing the micropipettor after every go.
* Add 20 ul of the enzyme solution into each of the microfuge tubes.
* Place all the microfuges into a water bath, using floats to keep them above water (for a good experimental result, the temperature should ideally be above 30 degrees centigrade, but below 40 degrees centigrade, because, if the temperature is too low, then the enzymes will work too slowly, but on the other hand, if the temperature is too high, then the enzymes will become deformed. This will change the active sites, and stop it from being specific). This temperature will help the enzymes to perform to their peak in the experimental time that I had.
* Using a stopclock, I will time for how long the enzymes stay in the water baths for, and take them out at precisely the same length of time as each other has had. This will ensure that all the enzymes are under the same conditions, apart from 1 difference, which is the pH of the solution in which they are placed.
* After their allowed time, as soon as I take the tubes out of the water baths, then I will mix in 100 ul of sodium carbonate to make the solution alkali, so the reactions will stop practically instantly, so that I can measure the rates of reaction, without some carrying on for longer than others.
* This sodium carbonate also turns the product solution into a pinky/magenta colour, and so I will use magenta filters to see what molarity of magenta it turns into, and then I can record the results, and form a graph.
* Using magenta filters, look at how much product has been formed from the substrate, and then see in which pH microfuge has gone the deepest shade of magenta.
Prediction
I predict that, as the phosphotase is an acidic based enzyme, the enzymes that were located in the acidic based buffer solution should have reacted more quickly during the period of time allowed, producing more product from the substrate, and so going the deepest shade of magenta. Of the acidic-based enzymes, I expect the enzymes in the pH closest to its optimum, even if this is not the strongest acidic pH. Therefore if the optimum pH of the phosphotase enzyme is pH 6, then I expect the enzymes in the closest range of PH 6 to have reacted most, sop if there were enzymes in a buffer solution of pH1, and there were also enzymes in a pH of 4, then I would expect the enzymes in pH 4 to have reacted more. However, if the enzyme were to deform at pH 3, then I expect the results to be the same for when the pH of the buffer is 1, or 2.
Preliminary Results
Magenta reading (m)
pH
Time (minutes)
0
3
15
0.3
4
15
0.4
5
15
0.2
7
15
0
9.2
15
This is just one set of results which I used as a guidance for all the rest of the results that I was about to obtain. From this experiment, I decided that 15 minutes was enough in order to obtain a good result, and also that the centrifuge only needed 3 minutes to obtain good results.
Results
Due to a lack of time, I only got 1 extra set of results, but in order to obtain a good set of results and so form a good graph, I compared my results to that of a friends. From these results, I have also derived a graph.
Magenta reading (m)
pH
Time (minutes)
0.1
3
5
0.5
4
5
0.3
5
5
0.1
7
5
0
9.2
5
These were my results
Magenta reading (m)
pH
Time (minutes)
0.1
3
5
0.3
4
5
0.4
5
5
0.1
7
5
0
9.2
5
And these were my friends results, which I will call my 2nd set
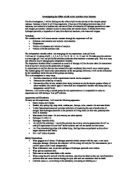
Graph to show the results between my 1st and 2nd sets of results,
and my preliminary results
0.6
0.5
0.4
0.3
0.2
0.1
0
1 2 3 4 5 6 7 8 9 10
pH of the solution
pH 9.2
From the above graph, the yellow line represents my friend's results, the black line represents my results, and this is further compared to the green line of my preliminary results. From here, you can see that there most certainly IS a pattern, but it may not be perfect, due to even the smallest of inaccuracies and mistakes. From this graph, the differences may seem great, but in actual fact, as I have rounded to 1 decimal place (for the magenta reading). Therefore, the difference between 0.1m and 0.2m could be minute, as there is the inconvenience of trying to use the eye, where inconsistency could play a major part.
Analysis
From the results, you can see that the patterns between the 3 curvy lines are similar. There is the fact that at both extremes of acidity and alkalinity, the enzymes show a decline in reactivity. This is as I expected, because of the fact that the enzymes may become deformed, and so the specific active sites are no longer specific to that single protein, and so the protein will no longer fit into the active sites. Therefore, the catalysing process is no longer sped up to its full potential. Then, as the pH changes from strongly acidic (pH 0-3) to weakly acidic (pH 4-6), then the rate of reaction has sped up, showing that the enzymes are finding the solution suitable to work in. Therefore, we can see that the enzyme works best in weakly acidic surroundings. This was what I expected, as I knew from the beginning that the phosphotase enzyme was an acidic-based enzyme due to my background information. However, I was wrong in thinking that the enzyme would react better if the solution it was suspended in was of stronger acidity. Therefore, I have drawn a straight-line (turquoise), which I think would represent the closest to the actual optimum pH of the phosphotase enzyme, but this was formed from a compromise between all 3 of my results tables. As you read off the graph, I think the actual optimum point would be where the turquoise line runs through, as this is a compromise. However, I cannot vouch for any of these, due to the fact that I have not got that many results to compromise from.
Having all the results turn out similar, I have proved some of my prediction right, and some of my prediction wrong. Of the three graphs, there is a chance that my results were wrong and the others actually closer to the true optimum pH, but there is also the chance that both my preliminaries AND my second set of results were wrong. But the 1 fact is that the phosphotase enzyme works best in weakly acidic conditions (in the graph, I have not displayed the whole pH range from pH 0-14, because I felt that there was no point, as obviously the rate of reaction would not rise past the optimum pH, and I have determined the whereabouts of the optimum pH).
Evaluation
What the experiment lacked was time in order to get rid of unwanted and unnecessary mistakes and inaccuracies. The differences between my results could have been down to time, with time pressure on my back, I could have made simple mistake if I didn't have that pressure. Lots of small mistakes could in the long run add up to a great difference. I think that the 3 sets of results could all have been wrong, but of the three, if my 1st results were wrong, then I believe that my other 2 sets of results are close to the actual optimum pH, but if the 1st set of results is closer to the optimum pH, then I think that there was the chance that I have made the same mistake twice, but not with first result. Because I only have 3 results to find an average of, there is the greater probability that my 1st set of results was wrong, but there is also the probability that my 2nd AND preliminary results were wrong, where my 1st set of results may have been closer to the actual optimum.
Overall, I think my results came out well, because there was only a slight variance in all 3 results, with no really obvious anomalous results, but if there were to be one, I would think that it would be the pH 4 result of my 1st set of results, because the other 2 had exactly the same results but this one was slightly different, and gave the whole graph a greater peak.
In order to extend this project, I could have given more time for the enzymes to work in the water baths, and then, because they are all left in the water for the same time, the results should have come out directly proportional. Then, I could have tried to use different enzymes with an alkali pH, and see if the graph turns out similar, and then more enzymes with different pH's, and then different enzymes with the same optimum pH.
By shin young Kim 5 aleph