Temperature – according to the data found in my first reference Ref 1, below 24oC the specie that became extinct was normally T. cs, but above 34oC, it proved dominant. I will use a range of temperatures, starting at 20oC, and increasing by 3oC up to 35oC, which should give me a varied set of results, where either specie can be proved dominant, submissive, or in between and coexist. This can be done in a thermostatically controlled incubator. As 29oC is the optimum for coexistence, it’s the temperature I will use when changing the type of flour.
Type of food – the beetles primarily attack milled grain products, such as flour and cereals, feeding not on the whole grains kernels, but the dust and damaged, broken kernels. The different species may thrive on a crop that is grown more commonly in their climate habitat, for example.
Prediction
I predict that at temperatures below 29oC, T. cf will have the highest percentage survival rate, but not above 29oC. At 29oC, due to the flour being native to more Southern climates, I predict T. cs will be more dominant.
When different types of flour are used, I predict that the origin climate which the crop is native to will determine which specie has the higher percentage survival rate.
Precision
To ensure receiving the most accurate results as possible, I will aim to keep all other conditions as constant as possible. This includes volume of flour, number of starting beetles, time that the experiment runs for and, when not in question, the temperature and type of flour.
Because the organisms are reproducing over a long period of time, controlling every aspect is impossible, so I will repeat each experiment twice, so that I may take an average result which will be more accurate.
Furthermore, I will take my result as a percentage survival rate of the beetles, dividing the end quantity by the starting quantity, and multiplying by 100. I will count the beetles every 15 days to ensure a trend is being followed.
Counting
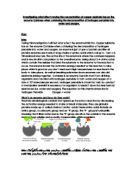
To count the beetles, remove the covering muslin cloth and paper towel, and gently empty into a fine sieve over a container. Shaking gently, separate the beetles and flour, and then they can be counted in a Petri dish, using a hand lens to distinguish between the two species, taking into consideration only those that can be clearly distinguished; larvae and very young beetles are to be ignored, as they can give anomalous results
T. cf have antenna that grow to form four club segments, whilst T. cs have 3 larger segments at the end of the antenna, furthest from the base. Ref 3
Method
- In a jam jar, add a 1:20 ratio of yeast and corn flour so that it has a depth of 5cm. Half bury a rolled up paper towel so that it projects above the flour.
- Add 10 beetles from each culture.
- Cover the jar with a muslin cloth and use an elastic band to seal it tightly around the rim.
-
Place in a thermostatically controlled incubator, preheated to 29oC, and leave for 150 days, counting and recording the populations of beetles every 15 days.
- Repeat steps 1-4 twice.
- Repeat steps 1-5 for Irish Wheat, Chestnut, Noodle and Tapioca flour.
-
Repeat steps 1-5 for 20oC, 23oC, 26oC, 32oC and 35oC.
Apparatus
Jam jar Corn flour
Muslin cloth(prevents beetles escaping) Irish Wheat Flour
Elastic band Chestnut Flour
Paper towel Noodle Flour
Hand lens Tapioca Flour
Sieve & plate
Counter (to measure days)
Results
See attached Tables and graph
Constraints
When selecting a culture of beetles, it’s highly difficult to ensure even ratio of sexes, so anomalous results may arise if there is a high proportion of one gender to another, and reproduction is a limiting factor.
Identifying the beetles will also be difficult as they are very similar in appearance, especially before reaching adult stage, and will be moving under the hand lens, so slight anomalous may occur.
As with organisms, controlling every environmental factor is impossible, so it must be taken into consideration that unexpected mortality or reproduction may occur.
Hazards and precautions
People may be allergic to the beetles, particularly sufferers of asthma should take care when handling them.
Table showing percentage survival of species every, including 2 repeats, for the first 15 days, using different temperatures and flours; must be continued up to and including 150 days. This can then be summed up in an average table, from which a graph can be plotted for the average percentage survival at different temperatures, as predicted below. A bar chart can show average percentage survival for different flours.
References
Ref 1 -
This reference was used to give a definition and extract information about the survival of the beetles at certain temperatures.
Ref 2 – “Biology 2”, page 32 by Mary Jones and Jennifer Gregory, ISBN 0-521-79714-4
This reference was used to extract information given in a graph.
Ref 3 – Images and identification information obtained from
Total Word Count (including attached tables and graphs): 1020