Propanol
CH3(CH2)2OH + 4½ O2 3CO2 + 4H2O
Butanol
CH3(CH2)3OH + 6 O2 4CO2 + 5H2O
Pentanol
CH3(CH2)4OH + 7½ O2 5CO2 + 6H2O
See (2)
Another way to find out the enthalpy of combustion of an alcohol is to actually combust each of the alcohols. When an alcohol is burnt, it heats up the surroundings (due to energy released from the reaction). It would then be possible to measure the amount of energy released from the system (reactants) or the energy given to the surroundings (both are the same).
We can use the energy released from the reaction to heat up a particular surrounding that has a known specific heat capacity (SHC).
The SHC of a substance is the amount of energy needed to raise gram of that substance by one degree Celsius, or by one degree Kelvin (the Kelvin scale is the standard temperature scale). Although these two scales begin at different points (the Celsius scale is 273 degrees behind the Kelvin scale i.e.
0°C = 273 K), the difference in degrees is the same, so a temperature rise of 1°C is the same as a rise of 1K.
Anyway, about the specific heat capacity, it is measured in joules per gram per degree Kelvin (Jg-1K-1). Water has a heat capacity of 4.2 Jg-1K-1 (approximate), this means it takes 4.2 joules to raise one gram of water by one degree Kelvin. The heat capacity of water actually varies at different temperatures (see table and graph below).
See (3)
Because of the variations in the heat capacity of water, the actual heat capacity used in my equations will depend on the where the temperature rise occurs.
If we heat up a known mass of water by so many degrees, we can work out the energy given to the water in the below equation:
ΔE = mcΔθ
(ΔE – Energy, m – mass, c – SHC, Δθ – change in temperature)
EXAMPLE:
If 100g of water were heated up from 20°C to 25°C, the amount of energy going into the water would be:
ΔE = mcΔθ
ΔE = 100g x 4.18 Jg-1K-1 x (25-20°C)
ΔE = 100g x 4.18 Jg-1K-1 x 5°C
ΔE = 2090 J
ΔE = 2.09 kJ
(4.18 Jg-1K-1 was used as a heat capacity because it is the average heat capacity of water at that temperature range)
PRELIMINARY TEST
At this stage, it would be helpful to do a pre-test, to have an idea of the results that I am likely to get. The pre-test will also give me the opportunity to identify possible errors and problems that could arise and to give me the chance to rectify any of them on any of them.
I have decided to follow the practical on Activity DF1.2 (4), titled “Measuring the Enthalpy Change of Combustion of Different Fuels”.
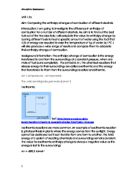
The apparatus used in the pre-test. (4)
PRELIMINARY METHOD (FROM ACTIVITY DF1.2)
-
Put 200 cm3 of water in a copper calorimeter and record it temperature.
- Support the calorimeter over a spirit burner containing liquid fuel you are going to test. Arrange a suitable draught exclusion system and any other features that you can think of to reduce energy loss.
- Weigh the spirit burner.
- Replace the burner under the calorimeter and light the wick.
- Use the thermometer to stir the water all the time it is being heated. Continue heating until the temperature has risen by about 15 – 20 °C.
-
Extinguish the burner. Keep stirring the water ad note the highest temperature reached.
- Weigh the burner to see what mass of fuel has been burnt. (Again think about how can reduce inaccuracies.)
PRELIMINARY RESULTS
Combustion of Ethanol
Mass of Burner Before Exp : 172.25 g
Mass of Burner After Exp : 170.30 g
Mass of Ethanol Burnt : 001.95 g
Mass of Water Used : 200 g (200 cm3)
Initial Temperature : 19 °C
Final Temperature : 41 °C
Change in Temperature : 22 °C
Then we can use the ΔE = mcΔθ equation to work out the energy that was given to the surroundings.
ΔE = mcΔθ
ΔE = 200g x 4.18 Jg-1K-1 x 22 °C
ΔE = 18,392 J
However, this is the amount of energy released when only 1.95 grams of ethanol are burnt. One mole of ethanol weighs 46 grams, therefore:
ΔE (mol-1) = 018,392 J x 46/1.95 (the step-up factor)
ΔE = 433,862.6 Jmol-1
ΔE = 433.9 kJmol-1
(As this energy is released by the ethanol to the surroundings, it should be a negative number, –433.9 kJmol-1.)
The actual enthalpy of combustion for ethanol is –1367.3 kJmol-1 (2). The pre-test shows that the amount of energy released to the water is less that a third of the real amount. So where did the rest go?
Obviously, some of the energy went towards heating up the calorimeter that the water was placed in. This would mean that the same equation that was used to calculate the energy given to the water could be used to calculate the energy absorbed by the calorimeter.
The mass of the calorimeter was 112.98 grams. The temperature rise in the calorimeter would be the same as that of the water i.e. 22°C. The specific heat capacity of copper is 0.385 Jg-1K-1 (3).
ΔE (to cal.) = 112.98g x 0.385 Jg-1K-1 x 22 °C
ΔE = 956.94 J
ΔE (mol-1) = 966.94 J x 46/1.95
ΔE = 22573.98 J
ΔE = 22.6 kJ (or –22.6 kJ)
Now, we know that the total energy released to the water and the copper calorimeter is –456.5 kJmol-1, however this is still nowhere near the actual amount of energy released when ethanol is burnt, –1367.3 kJmol-1.
This would suggest that most of the energy is lost towards heating the air around the apparatus. The results achieved by calculating the heat energy given to the water and the calorimeter seem rather insufficient and insignificant in comparison to the actual enthalpy of combustion.
IMPROVING THE METHOD
In order to get more meaningful results, it is better to work out the heat capacity of the all of the surroundings (i.e. water, calorimeter and surrounding air). In other words, if I know the amount of energy that was given to the surroundings and I also know the temperature rise, I would then be able to work out the overall heat capacity of the surroundings.
However, the heat losses (mainly to the surrounding air) are not directly proportional to temperature rise. As temperature rise increases, heat losses increase at an ever-increasing rate. (See below graph)
This means that the lower the temperature rise, the smaller the heat losses are. I have decided to keep the temperature rise around 10 °C.
The overall heat capacity of the apparatus does not only depend on the temperature rise, as the amount of matter in the surroundings will also affect the overall heat capacity. In order to keep the experiments fair tests, I will use the same mass/volume of water in all of the experiments. I will also use the same calorimeter in all of my experiments.
By keeping all of the above variables constant, the heat capacity of the all of the surroundings should be constant.
Instead of using 200 cm3 (as in the preliminary), I decided to use 100 cm3. Using 200 cm3 requires a large calorimeter and this could increase the heat loss, therefore it is better to use the smaller calorimeter.
Measuring the volume of the water using a cylinder is very inaccurate as the readings are very close to each other. Therefore, I’ve decided to weigh the water instead. As water has the density of 1 gcm-3, its mass in grams is equal to its volume in cm3. The mass scales available measure to 1/100 of a gram (i.e. 0.00 g, or 2 d.p.). The measuring cylinders are far less accurate. It is hard to distinguish between one mil and the next on a measuring cylinder, let alone 1/100.
Another problem with inaccuracy arose with the thermometer. Just like the measuring cylinder, the readings on the thermometer were too close to one another. This problem was helped by my decision to use a data logger, which measures temperature to 1/10 of a degree (i.e. 0.0 °C, 1 d.p.). This will further improve the accuracy of my experiments.
(NOTE: The above section can also be considered as part of THE EVALUATION)
I have decided to investigate as many alcohols as are available to me (i.e. the ones the school can afford to buy) and I am aiming to test each alcohol four times, as it will be easier to identify anomalous results and will make better averages.
CALIBRATING THE HEAT CAPACITY
In order to calculate the heat capacity of the apparatus plus the surrounding air, I need to know the amount of energy that went towards heating them up and the temperature rise caused by that energy. Once I have these two values, I can work out the heat capacity of the surroundings. Here, the mass of the surroundings is irrelevant, as it will be kept constant throughout all of the experiments.
I have chosen methanol as the base alcohol to calculate the heat capacity of the surroundings, as it is the first in the series. It is the most basic alcohol.
In one the experiments with methanol, the following results were obtained:
Mass of Burner Before Exp : 210.81 g
Mass of Burner After Exp : 210.32 g
Mass of Methanol Burnt : 000.49 g
Initial Temperature : 16.2 °C
Final Temperature : 27.5 °C
Change in Temperature : 11.3 °C (or 11.3 K)
From the datasheets (2), I know that the enthalpy of combustion of methanol is –726.0 kJmol-1. A mole of methanol weighs 32 g. Therefore, the energy supplied to the surroundings by burning 0.49 g of methanol is:
726.0 x 0.49/32 = 11.117 kJ
This 11.117 kJ managed to heat up the surroundings by 11.3 K. This means that the overall heat capacity of the surroundings is:
11.117 kJ/ 11.3 K = 983.8 JK-1
As long as the temperature rise is kept around 10 °C and the contents of the surroundings are also kept the same (i.e. the mass/volume of water used is the same and the same calorimeter is used) the heat capacity (above) should remain constant.
Another calibration result gave the heat capacity as 907.5 JK-1, making the average heat capacity of 945.7 JK-1, and this will be the heat capacity used in the calculations of my results.
SAFETY
This investigation involves a number of hazards that must be considered and necessary steps taken to prevent accidents from occurring.
Obviously, the experiments involve combustion and all of the alcohols are highly flammable. This means that care should be taken to prevent burning, both body and clothes worn. Eye protection must be worn at all times.
Alcohols are also volatile (vaporise easily) and great care must be taken to keep containers closed. They should not be refilled near naked flames. Fumes of alcohols should never be inhaled, especially methanol as it is toxic.
PREDICTION
As the № of carbons in the alcohol is increased, the enthalpy of combustion also increases but, why? This can be explained if we compare one alcohol with the next in the series.
The only difference between one alcohol and the next is a (–CH2–) group inserted in the middle of the chain. This effectively means that when the second alcohol is combusted:
2 extra C—H bonds are broken (in comparison to the previous alcohol)
1 extra C—C bond is also broken (in comparison to the previous alcohol)
1.5 extra O=O bonds are also broken (in comparison to the previous alcohol)
And in return:
2 extra C=O bonds are made (in comparison to the previous alcohol)
2 extra O—H bonds are made (in comparison to the previous alcohol)
From the above information we can calculate the extra energy needed and the extra energy released from the second alcohol:
Energy needed = 2x413 + 347 + 1.5x498.3 = +1920.45 kJ
Energy Released = 2x805 + 2x464 = – 2538 kJ
Net Change (Enthalpy) = – 617.55 kJ
Every time we combust 2 consecutive alcohols, we should expect the second to release an extra 620 kJmol-1 (this is an approximation, for further elaboration, see “COMBUSTION OF METHANOL” section). This leads to me to, not only predict the pattern, but also have conclusive evidence backing up my prediction.
RESULTS
The results table and graph (titled “Combustion of Alcohols – Results”) show the information gathered from the practical.
ANALYSIS
The results show that, as predicted, the enthalpy of combustion increases as the № of carbons increases (or as the molar mass increases). Positive correlation between the enthalpy of combustion and molar mass can be seen on the graph. The relationship seems to be directly proportional.
As shown above (in the “PREDICTION” section), the increase in the enthalpy of combustion (when the № of carbons is increased) can be explained by using bond enthalpies. By comparing the number of bonds broken and bonds made when two different alcohols are combusted, we can calculate difference in enthalpy between the two alcohols.
Although the relationship between molar mass and enthalpy of combustion is evident in my results, there is a large difference between my results and the theoretical figures quoted on the table in the “COMBUSTION OF OTHER ALCOHOLS” section (these are plotted onto the graph to indicate the difference) (2). Although the large difference is a sticky point, it does not undermine the investigation. There is, undoubtedly, a pattern in the results gathered.
This would suggest that my experiment was not as through as the procedures used to measure the enthalpy of combustion for data banks like Data Sheets: Table 17 (2) (Appendix A). This will be further discussed in the evaluation.
EVALUATION
Although my results show a very good trend, there are a few anomalies. For example, the last experiment with methanol is clearly anomalous (It is highlighted on the graph). Another anomaly is the last result of propanol (also highlighted on the graph), however this anomaly is small when compared with the methanol anomaly.
The first three of the methanol and propanol experiments were all carried out on one day, where as the last of the experiments were carried out on a different date. As the room temperature was different on the two days (in fact, the second day was a lot colder than the first), this would have affected amount the heat given to the surrounding air. Therefore, the results from the second day would have been different from the results of the first.
In order for the calibrated heat capacity to be credible, all of the factors that could affect the heat capacity (in the surroundings) had to be kept constant. Because the surrounding air was cooler on the second day, it would have taken more energy to heat up the surroundings by the same temperature rise. As a result, more alcohol would have been burnt to achieve the same temperature rise. This, in turn, meant that the step-up factor (to convert kJ into kJmol-1) would have been smaller and so the enthalpy in kJmol-1 would have been smaller.
The accuracy of the equipment, in my point of view, was more that satisfactory for this experiment. As commented upon earlier, I used the most accurate equipment available to me, and fortunately, it was quite accurate.
PERCENTAGE ERROR CALCULATIONS
The smallest mass measured was 0.34 g (amount of butanol burnt in the first butanol experiment). The electronic scales measure to 2 d.p. and so they have an error of ± 0.005 g. Therefore the % error is:
0.01/0.34 x 100 = 2.9%
Another set of measurements taken were the temperatures. The lowest temperature recorded was 7.2 °C and the data logger (electronic thermometer) was accurate to 0.1 °C (i.e. has n error of ± 0.05 °C), so the percentage error is:
0.1/7.2 x 100 = 1.4%
(NOTE: this is a much smaller error that when compared with the normal thermometers. As they measured accurately to only 1 °C, the percentage error would be 14%. Using the data logger definitely improved the accuracy.)
The results I obtained from the experiments (for the enthalpy of combustion) are nowhere near the theoretical amount that I should have got (2) (even taking into account the above percentage errors).
The main source of error here is the lack of complete combustion. All of the values stated on the data sheets (2) are for complete combustion, i.e. all of the reactants are converted in carbon dioxide and water, and nothing else.
Most of the combustion reactions in this investigation, especially propanol, butanol and heptanol, involve a lot of carbon. Converting all of the carbon atoms into carbon dioxide molecules requires a lot of oxygen, which was not available from the air around the flame alone. Often, carbon monoxide and carbon (soot) form, reducing the amount of energy released (Appendix B). Incomplete combustion is less efficient that complete combustion. It is this difference (between complete and incomplete combustion) that causes the theoretical graph and my results graphs to separate, and it is a very big separation at around heptanol.
The problem of incomplete combustion could be tackled by adding oxygen to the ignited fuel. This can be through adding fans to increase the level of oxygen supply to the fire. Or, we could use oxygen from oxygen tanks and supply pure oxygen directly to the flame (obviously, this will involve careful risk assessment). By supplying the [combustion] reaction with ample amounts of oxygen, the reactants are able to completely combust and therefore, more energy is given to the surroundings and therefore the gap between the theoretical and my results should be reduced significantly.
Other simple and perhaps even trivial factors could have caused the gap, such as the purity of the alcohol. I could have tested the alcohols for their purity and so another source of error is identified. This also raises the question of how isomers can affect the enthalpy of an alcohol. It is known that branching an alcohol reduced the enthalpy of combustion (2), but why?
Another possible source of error is the fact that some of the heat energy evaporated the water in the calorimeter, rather than just heating up the water. By placing a lid on top of the calorimeter, the amount of energy wasted towards evaporation would have been reduced and more of the energy is used to heat the surroundings thus giving a more reliably result.
APPENDIX A
When measuring the enthalpy of combustion, chemists use bomb calorimeters. These are special containers (see diagram) and it is highly specialised to measure the enthalpy of combustion.
The Bomb Calorimeter (6)
Firstly, the water being heated surrounds all
of the calorimeter. This means that there is
no place for the heat to be transferred other
than the water. There are no heal losses to surrounding air, because there is no surrounding air, just water. The heat can only escape through the water.
Secondly, the combustion occurs in a pressurised oxygen atmosphere, preventing incomplete combustion. The significance of incomplete combustion is discussed in the next appendix.
APPENDIX B
Suppose that, in the worst-case scenario, the products of the combustion of the alcohols were only carbon monoxide and water. How will the energy released differ? Here again, I will be using bond enthalpies to give us an indication of the energy released.
CH3OH + O2 CO + 2H2O
+ +
Bonds Broken:
3 C—H 413 kJmol-1 (average)(1)
1 C—O 336 kJmol-1 (as in CH3OH) (1)
1 O—H 464 kJmol-1 (as in H2O) (1)
1 O=O 498.3 kJmol-1 (as in O2) (1)
Bonds Made:
1 C O 1076.5 kJmol-1 (as in CO)(5)
4 O—H 464 kJmol-1 (as in H2O) (1)
Enthalpy = {(3x413) + (336) + (464) + (498.3)} – {(1076.5) + (4x464)}
= 2537.3 – 2932.5
= –395.2 kJmol-1
This shows that if methanol was to undergo incomplete combustion, only 54% of the energy given out when compared with complete combustion (–726.0 kJmol-1). So clearly, incomplete combustion can cause a large error (46%).
Incomplete Combustion Of Ethanol:
Bonds Broken:
5 C—H 413 kJmol-1 (average) (1)
1 C—O 358 kJmol-1 (average) (1)
1 O—H 464 kJmol-1 (as in H2O) (1)
1 C—C 347 kJmol-1 (average) (1)
2 O=O 498.3 kJmol-1 (as in O2) (1)
Bonds Made:
2 C O 1076.5 kJmol-1 (as in CO)(5)
6 O—H 464 kJmol-1 (as in H2O) (1)
Enthalpy = {(5x413) + 358 + 464 + 347 + (2x498.3)} – {(2x1076.5) +
(6x464)}
= 4230.6 – 4937
= –706.4 kJmol-1
The problem of incomplete combustion is highlighted here again. If ethanol were completely combusted, it would release –1367.3 kJmol-1. Only 52% of this is released when the ethanol is incompletely combusted (as shown above), making a 48% error.
REFERENCE
(1) Salters Advanced Chemistry: Activities and Assignments Folder
Heinemann Educational Publishers
1994 (First Publication)
Data Sheets
Table 18: Bond length and bond enthalpies
Pg. 421
(1) Salters Advanced Chemistry: Activities and Assignments Folder
Heinemann Educational Publishers
1994 (First Publication)
Data Sheets
Table 17: Organic compounds: physical and thermo-chemical data.
Pg. 420
(3) http://hypertextbook.com/physics/thermal/heat-sensible
NOTE: On the website, all of the heat capacities are stated in Jkg-1K-1
whereas the in my write up, they are stated in Jg-1K-1. So all of the
heat capacities in my write-up are a thousandth of those on the
website.
(4) Salters Advanced Chemistry: Activities and Assignments Folder
Heinemann Educational Publishers
1994 (First Publication)
DF1.2 (Measuring the Enthalpy Change of Combustion of Different
Fuels)
Pg. 20-21
(5) http://www.webelements.com/webelements/elements/text/C/enth.html
(6) Salters Advanced Chemistry: Chemical Ideas
Heinemann Educational Publishers
1994 (First Publication)
Unit 4.1 “Energy out, energy in” – Figure 3
Pg. 47