By re-arranging the equation Ek = ½ mv2 we can work out the velocity of the ball baring, 2Ek/m = v2 then do √ v2 = v. This can also be simplified to give √ (2mgh) /m = v. The “m” cancels which will leave us with V = √ (2gh). We can then use the equation V = Distance/Time which will give the theoretical horizontal value. We can re-arrange this equation to give us the distance, Distance = Velocity x Time. This is the horizontal component.
Changing the vertical height of the drop from the ramp would vary the range. This is because according to the law of energy, it cannot be made or destroyed but transferred. To apply this law into this practical, we can say all of the gravitational potential energy is converted into kinetic energy assuming no energy is wasted. As a result, gravitational portential energy is equal to kinetic energy.
I will also need to calculate the time by using the equation
S = u + ½ at2
We can simplify this equation to s = ½ at2
Or
2s/g = t2
Where we can change it to give me
t = √(2s / g)
This is the vertical component.
Safety:
When it comes to a practical experiment it is always important to consider health and safety. In this experiment, we are using a ball baring and so if due care isn’t taken then this could result in minor injuries especially to those who are carrying out the investigation or walking past. I need to make sure the landing zone is clear of obstacles. I will make sure there are no breakable objects around because the metal ball will bounce for a distance before it stops.
Variables
Dependent: The distance between the table and the point of contact of the ball barring.
Independent: Height/the point at which the ball baring is dropped from.
Control:
- The point at which the ball baring is dropped.
- The angle of the jump.
- Mass of the ball baring
For this experiment I aim to change the height of the ramp by 10 centimetres each time and test each height 4 times. I will use a meter ruler stating centimetres and millimetres to measure the height of the ramp from the table to the point of launch and measure the range between the table and the point at which the ball baring contacted the ground. It is important for me to bear in mind that my results may vary due to the forces of air resistance and friction throughout the experiment. To increase the accuracy of my results, I will make sure that the dropping point on the ramp will be the same throughout my investigation.
Equipment list:
- 1 Meter ruler stating centimetres and millimetres.
- Long length carbon paper
- 1 medium-sized ball baring
- Plastic ramp/run
- 4 x A3 Plain Paper
- Pencil
- Weighing scales (in Newtons)
- Clamp stand, boss and clamp
- Spirit level
- Masking tape
- 4 Thick books adjust the height.
- Table drawn with the correct values to record the results
Procedure
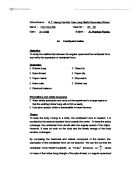
- Set up the apparatus shown in the diagram using the clamp stand boss and clamp, and the plastic ramp on top of a table.
- Place the carbon paper on the floor, placing 4 x A3 sheets of plain paper underneath the carbon paper.
- Make sure that the top of the ramp curves downwards towards the edge of the table, so the end of the ramp meets the edge of the table.
- Weigh the ball baring using the weighing scales (in Newtons) and note down the weight.
-
Make sure that the ramp is secure, use masking tape if needed and measured accurately using the meter ruler. The height (h1) is 30 cm from the table to the point of drop – this will be the starting height.
- Position the ball baring on the ramp where the bottom of the ball baring touches the 30 cm point. Steady the ball with your finger until release.
- Once ready, release the ball baring down the ramp, making sure that it hits the carbon paper. Repeat this 3 times. Measure the range from the furthest point of contact on the paper to the edge of the table.
-
Change the height of the ramp so the height (h1) is 40cm from the table to the point of drop by adjusting the clamp and lift it to the 40 cm on the meter ruler. Place the ball at the point where it was last dropped. Repeat step 7.
- Repeat step 8, positioning the height as 50cm, 60cm, 70cm and 80cm.
Diagram of apparatus
Results
Graph
Analysis
As you can see from the graph, as h1 is increasing, the horizontal distance also increases. The graph is more or less a straight line because the horizontal distance travelled by the ball baring in each interval should more or less be around the same. However it didn’t show that the y-component is directly proportional to the x-component. This could be of the inaccuracy of the equipment, measurement and air resistance when in travelling in the air and friction on the ramp. The accuracy of the meter ruler is quite poor when it comes to measuring the point at which the ball has landed. Therefore the uncertainties would be measuring precisely the point at which the ball baring had landed. It will be more or less ±1mm.
The position for releasing the ball baring is another issue. If the ball is being released from a higher or lower position compared to the previous test, it will have an affect on the initial velocity when leaving the ramp. Higher velocity will result in a bigger horizontal component and therefore uncertainties would be more or less ±1mm. The total uncertainty would be ±2mm.
The plastic ramp also creates a problem. The end of the ramp is difficult to maintain a precise horizontal position because of the bendiness of the plastic ramp. This is an important factor because it has an affect on the initial velocity and therefore will change the results. It will create a vertical acceleration if it bends resulting in an increase in the horizontal component.
In theory, we have assumed that the air through which the projectile moves has no effect on its motion, a reasonable assumption at low speeds. However, for a greater speed, the disagreement between calculations and the actual motion of the projectile can be large because the air opposes the motion of the projectile. So, a bigger h1 means the projectile will be in the air for longer; therefore the air resistance will affect the projectile more and consequently will reduce horizontal distance travelled. I believe this is the reason that the line on the graph isn’t directly proportional to the x and y components. Therefore in the absence of air resistance, I believe that the graph produced would be directly proportional to both x and y components.
In order to calculate the theoretical range, we have to find the horizontal and vertical component separately. I can use the following equations to find out both of the horizontal and vertical components.
Vertical Component:
GPE lost = KE gained
mgh = ½mv2
gh = ½v2
V = √ (2gh)Horizontal Component
Now finally after we found the velocity and the time, it would be very easy to calculate the distance using the velocity equal distance divided by time equation, which can be re-arranged to equal: -
Distance = Velocity x Time
I have used the equations above to produce the following table:
Below is a graph that shows the theoretical values and my actual values
Evaluation
There are different things that I could change to improve the accuracy of the experiment. I can put a gate as a releasing barrier at the point of dropping the ball baring to ensure that it is being released at the same point every time. This can also help to keep the initial velocity leaving the ramp the same for each trial. Strong tapes and sticky blue-tac can be used to keep the end of the ramp in position and to maintain at horizontal level. This helps to provide uniform acceleration for the vertical component.
In order to make the results as accurate as possible, we can try to eliminate all the uncertainties. However, some of the limitations cannot be eliminate. Air resistance is always present and is a force that always opposes the action of the ball baring. However, I can change the type of motion of the ball baring. I can use objects that slides rather than rolls down. However, it is hard to make the same object slide and not roll at the same time, whilst minimizing any friction that may occur. The ball baring is always going to roll down and produce a spinning effect. If a spinning effect occurs then energy is being released and wasted in the surroundings and perhaps not reaching the velocity that it could. If I use another object to slide down, the air resistance would be different and therefore it will only result in increasing the uncertainties due to an increase of friction on the ramp. But I can still carry further investigations in these criteria. Another interesting point would be changing the vertical acceleration of the ball baring. However, this is impossible for me since we will have to change the gravity of the surroundings for the ball baring to accelerate faster then 9.81ms-2.
In this investigation, I have taken account of h1 as my variable and all other factors are being fixed and so remain constant. I can also investigate h2 if I will do this experiment again. It is different from h1 because the ramp will always be in a fixed position and so the angle of the ramp will not change. So, the initial velocity will always be the same.
Conclusion
The conclusion to this experiment is that as the vertical projecting height increases, the horizontal distance travelled also increases. However, it is the air resistance and fiction of the ramp that limits the projectile motion. From my results, it shows that air resistance has little effect on the ball baring if the time spent in the air is less, when h1 is at a low height. However, if the ball baring travels in the air for longer, when h1 is at a higher level, the affect of air resistance is applied for longer when the projectile leaves the ramp and affects the horizontal distance travelled. From my results, I can conclude that my investigation supports my hypothesis and disproves my null hypothesis. However, this also proves that air resistance and friction is a big limiting factor.